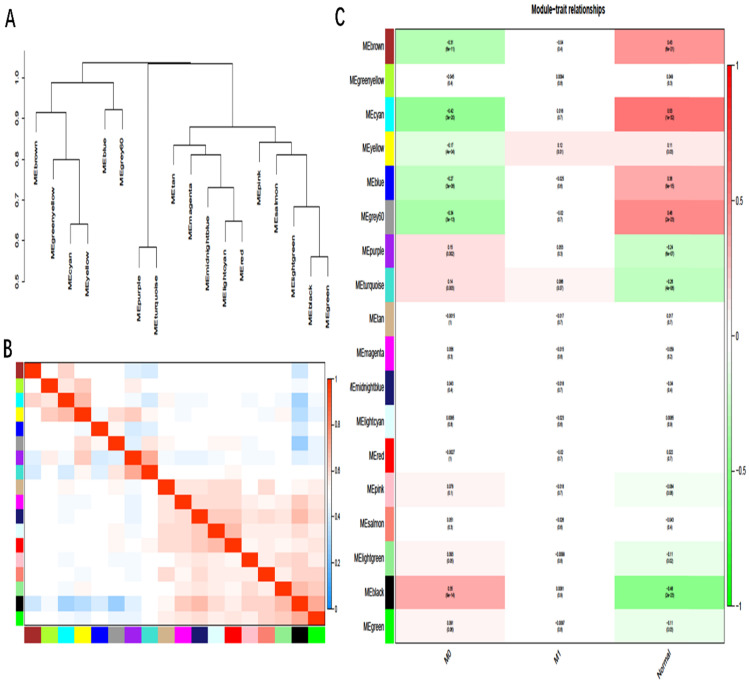
Figure 4.
A, B: Hierarchical clustering of heat maps and adjacent modules of feature genes. C: Module-trait relationships: Each row corresponds to a module eigengene, column to a trait; the correlation coefficient and corresponding P-value was shown in the correlation between the gene module and the clinical trait. M0: cancer, nonmetastasis; M1: cancer, metastasis.

