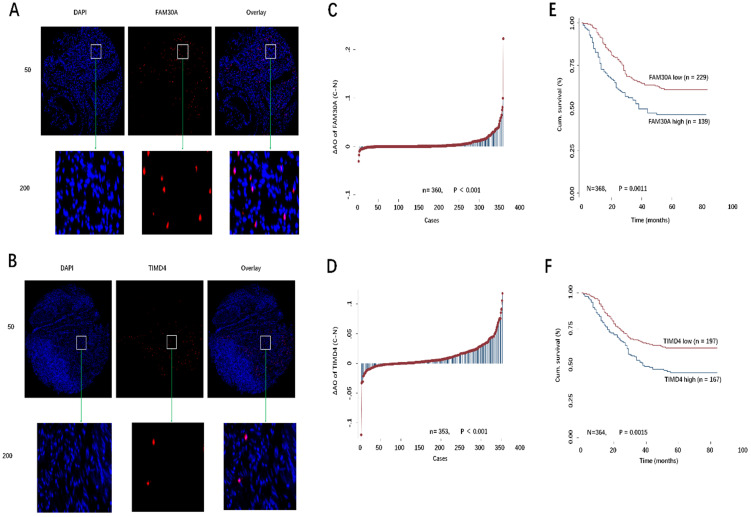
Figure 8.
A, B: Representative images of FAM30A and TIMD4 FISH immunofluorescence staining in TMA were showed: top panel: original magnification, ×50; bottom panel: ×200. C, D: The different distribution of FAM30A and TIMD4 in GC compared with paired normal tissues in TMA. E, F: Kaplan-Meier curves of the patients with low/high FAM30A and TIMD4 expression.

