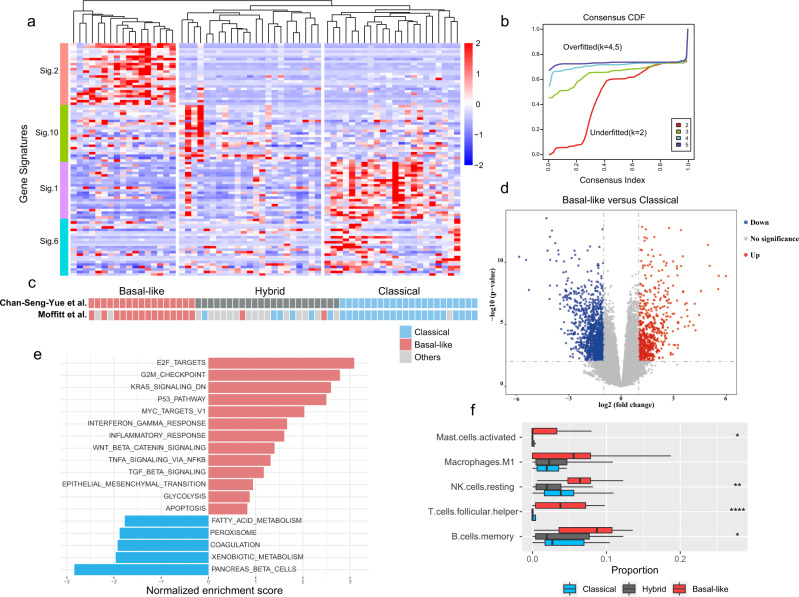
Fig. 1. Identification of PDAC subtypes by gene signatures.
a Heatmap of the three consensus clusters based on 4 groups of tumor-related signatures determined by Chan-Seng-Yue et al.23. Expression values were scaled in the row direction. Signatures 2 and 10 are basal-related signatures, while signatures 1 and 6 are classical-related signatures. Our PDAC samples were classified into basal-like (n = 17), hybrid (n = 23) and classical (n = 22) tumors. b Cumulative distribution function (CDF) plot from consensus clustering for different k values in our RNA-seq cohort. We chose k = 3 as the optimal cluster number. c Comparison of tumor clusters in (a) to the previous subtyping scheme by Moffitt et al.6. d Volcano plot showing differential gene expression in basal-like tumors compared with classical tumors. The up- and down-regulated genes were determined by adjusted P value < 0.01 and log2 fold change >1 and <1, respectively. e Enriched pathways of differentially expressed genes identified by GSEA in basal-like versus classical tumors. The length of bars denotes the normalized enrichment score of each category. f The boxplot denotes the proportion of five selected types of immune cells among basal-like, hybrid and classical tumors by CIBERSORTx. P values were determined by the Kruskal–Wallis test. * indicates the significance level.

