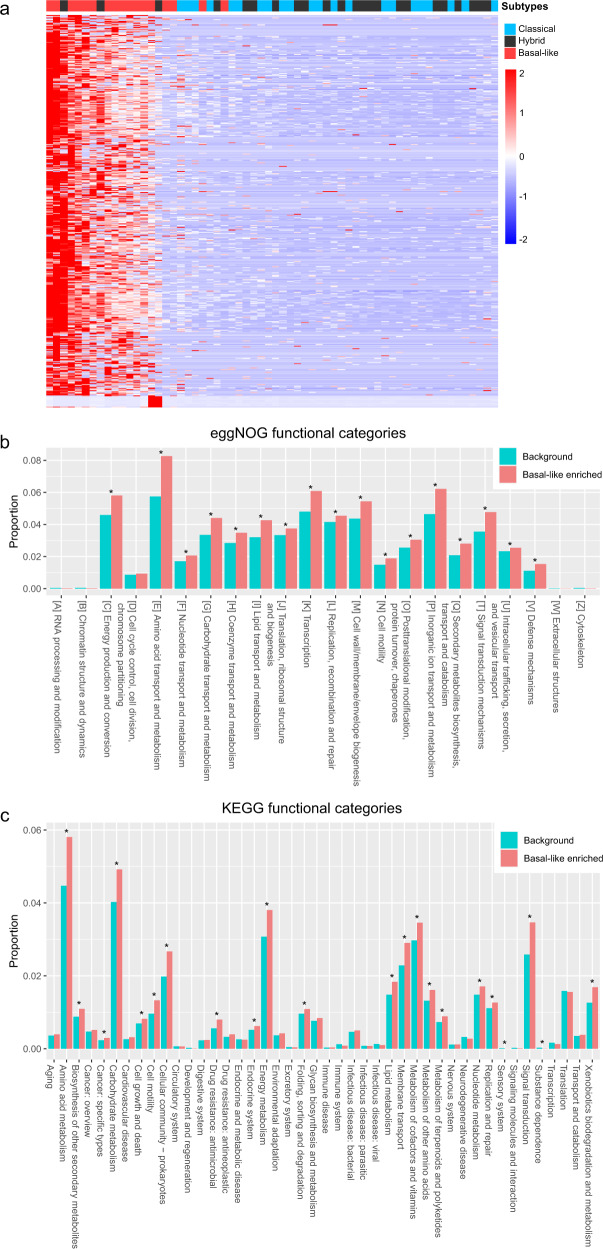
Fig. 4. Microbial genes enriched in basal-like tumors display higher pathogenicity.
a Heatmap of microbial genes with differential abundance across all PDAC samples. The heatmap contains 8960 genes (rows) and 62 samples (columns). b Comparison between the Basal-like enriched and background genes on OG functional categories. c Comparison between the Basal-like enriched and background genes on level 2 of KEGG functional categories. Significance was determined by Fisher’s exact test.

