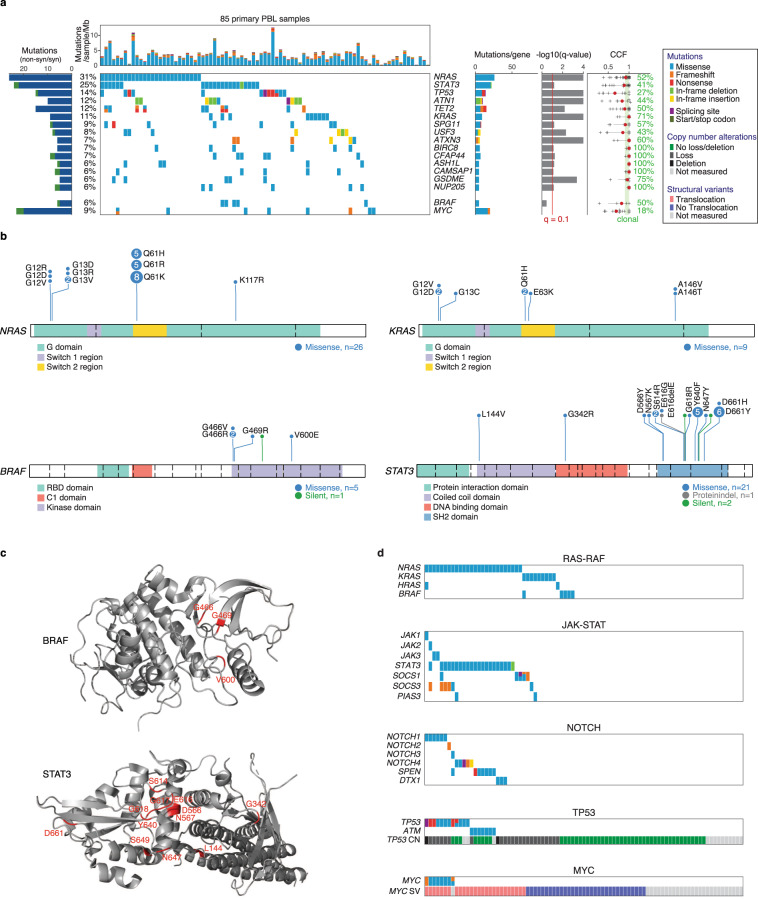
Fig. 1. Landscape of somatic mutations in PBL determined by WES.
a All called non-synonymous mutations in significant genes according to MutSig2CV v3.11 (qM2CV < 0.1, cohort frequency 5%) are color-coded and shown for each PBL sample per column, ranked by cohort frequency (see Supplementary Data 3 and 4 for all results). Samples are ordered by waterfall sorting based on binary gene mutation status. The bar graph on the left shows the ratio of non-synonymous (blue) and synonymous (green) mutations per gene. At the top, the TMB per sample (mutations/sample/Mb) is depicted. On the right, occurring types of mutation and q values (M2CV) are shown per gene. For each gene, the CCF (fraction of cancer cells having a mutation in at least one allele) was estimated for samples with corresponding copy number measurement (median in red). Clonality was assumed for CCF 0.9. The percentage of samples with clonal mutations is indicated per gene. b The distribution of detected mutations on protein level for the selected CCGs NRAS (NM_002524), KRAS (NM_033360), BRAF (NM_004333), and STAT3 (NM_139276). Exon boundaries are indicated using dashed lines. c Spatial clustering of mutations within the protein structures of BRAF (PDB 6nyb)95 and STAT3 (PDB 6njs)96. d Co-occurrence of mutations belonging to selected biological pathways. For each analyzed pathway, samples are presented in their corresponding waterfall sort order by binary gene mutation status. Copy number (CN) and translocation status (SV) are depicted for TP53 and MYC, respectively.

