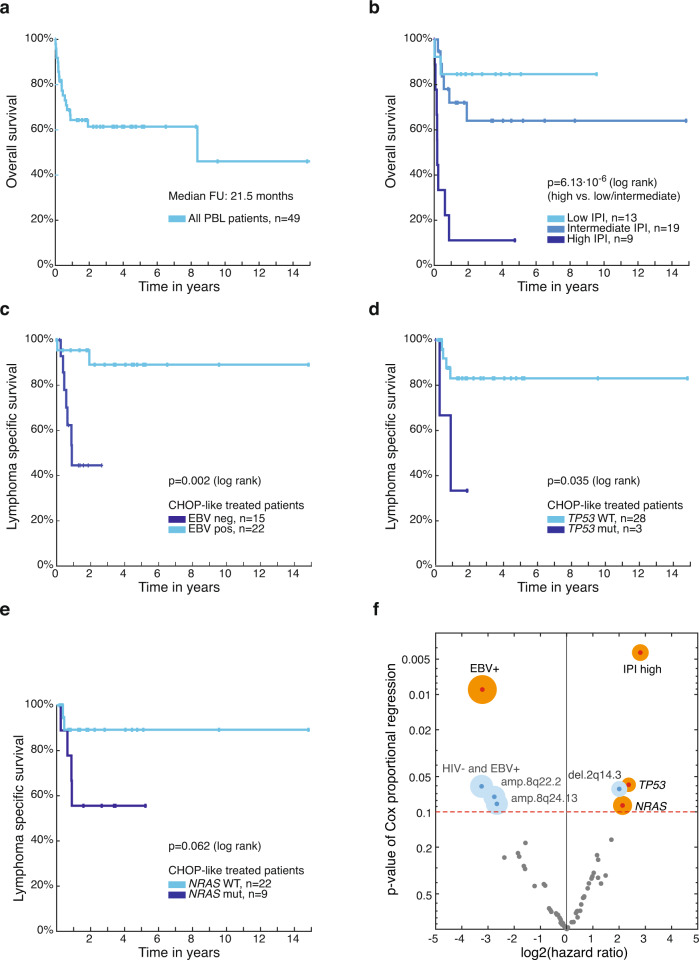
Fig. 3. Survival analysis of PBL patients.
Kaplan–Meier (KM) estimates showing a overall survival (OS) for all PBL patients with available follow-up (FU) (n = 49) and b OS according to IPI group (IPI low: 0–1, IPI intermediate: 2–3, IPI high: 4–5). Lymphoma-specific survival (LSS) shown for PBL patients treated with CHOP-like chemotherapy depending on c EBV infection status of lymphoma (neg negative, pos positive), on d mutational status of TP53, and e NRAS (wt wildtype, mut mutated). Corresponding p values of two-sided log rank tests are shown, for multiple hypothesis testing over preselected conditions see Supplementary Data 9. f Hazard ratios by Cox regression and corresponding pCox values describing the impact of significant mutations, SCNAs (with qM2CV/G2.0 < 0.1) or clinical metadata on LSS for PBL patients treated with CHOP-like chemotherapy. The size of the circle for parameters with p value <0.1 is proportional to the number of affected patients. Earlier findings confirmed by this unbiased exploratory analysis are highlighted in orange. No significant hypotheses with FDR q < 0.1 were found.

