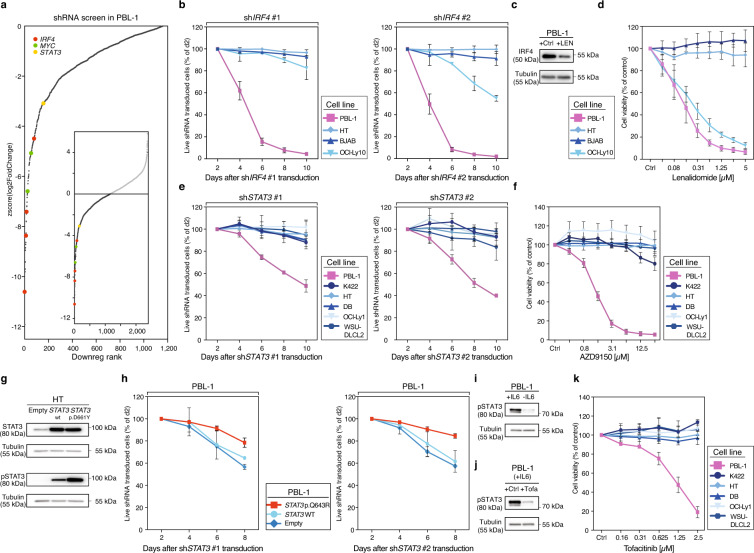
Fig. 4. Identification of molecular targets for the treatment of PBL.
a shRNAs used in the shRNA library screen performed in PBL-1 cells are sorted and ranked by the corresponding z-score of log2-transformed depletion ratios after 12 days (see Supplementary Data 10 for raw read counts). shRNAs targeting IRF4, MYC, and STAT3 are highlighted. b The graphs show the percentage of viable shRNA IRF4 #1/#2-transduced cells over time normalized to control shRNA and to day two fraction. Mean values ± standard deviations are shown of three experiments. c IRF4 protein expression by Western blot (WB) in PBL-1 cells treated with DMSO (Ctrl) or lenalidomide (LEN; 1.25 µM) for 24 h respectively. Representative results are shown of three independent experiments. d Cell viability after treatment with indicated concentrations of lenalidomide for 5 days normalized to DMSO-treated cells. Mean values ± standard deviations are shown of three experiments. e Effect of STAT3 knockdown by two independent shRNAs on cell viability of PBL-1 cells over time. Data were shown as means ± standard deviations of three experiments. f Relative cell viability after treatment with increasing concentrations of the STAT3 antisense oligonucleotide AZD9150 for 5 days. Data were shown as means ± standard deviations of three experiments. g Phosphorylated STAT3 levels determined by WB following transduction with a control plasmid (empty), wild-type (wt) STAT3, and p.D661Y STAT3 cDNA in HT cells. Representative results are shown of three independent experiments. h Exogenous expression of the p.Q643R STAT3 cDNA rescues PBL-1 cells from STAT3 shRNA-mediated toxicity. In contrast, a control plasmid (empty) or wild-type (wt) STAT3 did not induce a rescue of STAT3 shRNA-transduced PBL-1 cells. Data were shown as means ± standard deviations of two experiments. i Phosphorylated STAT3 levels determined by WB in PBL-1 cells supplemented with or without IL-6 (5 ng/ml) or j treated with the pan-JAK inhibitor tofacitinib (0.5 µM) for 4 h. Representative results are shown of three independent experiments. k The pan-JAK inhibitor tofacitinib decreases the cell viability of PBL-1 cells. In contrast, DLBCL control cell lines are unaffected by tofacitinib treatment. Data were shown as means ± standard deviations of three independent experiments. Source data for Fig. 4b–k are provided as a Source Data file.

