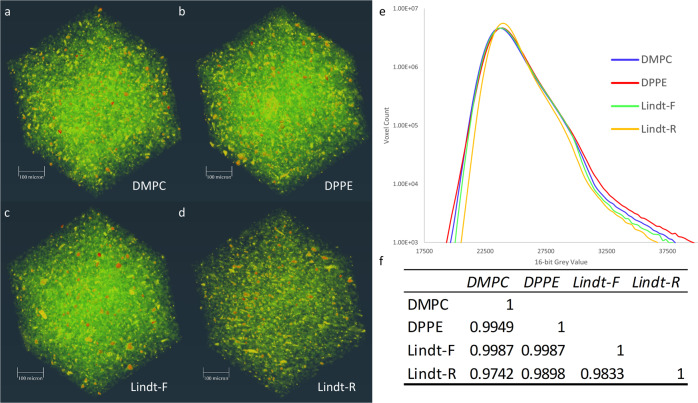
Fig. 6. Volume renderings of reconstructed slices, plotted histograms, and correlation matrix of SR-µCT data.
Samples included a molten and recrystallized commercial chocolate with added 0.1% (w/w) dimyristoylphosphatidylcholine (DMPC), Supplementary Movie 1; b molten and recrystallized commercial chocolate with added 0.1% (w/w) dipalmitoylphosphatidylethanolamine (DPPE), Supplementary Movie 2; c fresh commercial chocolate (Lindt-F), Supplementary Movie 3; d molten and recrystallized commercial chocolate (Lindt-R), Supplementary Movie 4; e plotted histograms, and f correlation matrix.

