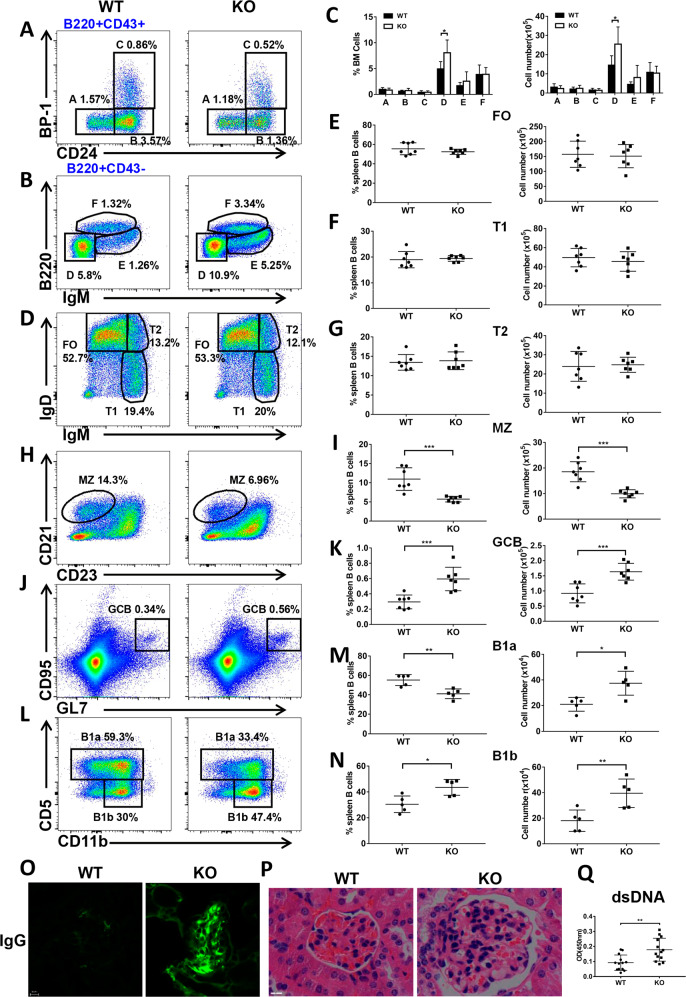
Fig. 1. CCL2 is important for the development of peripheral B cells but not bone marrow B cells.
A–C Flow cytometry analysis of pre-pro (A), pro (B), early-pre (C), late-pre (D), immature (E), and recirculating mature (F) B-cell subsets of BM cells obtained from WT and Ccl2 KO mice (n = 7). Shown are representative dot plots and statistics of the average percentages (±SD) and total cell number of the subpopulations of BM cells. D–K Flow cytometry analysis of follicular (FO), transitional 1 (T1), transitional 2 (T2), marginal zone (MZ), and germinal center (GC) B cells in splenic B cells from WT and Ccl2 KO mice (n = 7). Shown are representative dot plots and average percentages (±SD) and numbers of subpopulations in spleens. L–N Flow cytometry analysis of B1a and B1b cell subsets of peritoneal B cells from WT and Ccl2 KO mice (n = 5). Shown are representative dot plots and average percentages (±SD) and numbers of subpopulations in peritoneal B cells. O Immunofluorescent analysis of IgG deposits in kidney sections. Shown are representative glomeruli using a ×60 objective. Scale bar, 10 μm. P Hematoxylin and eosin staining of kidney from WT and Ccl2 KO mice (n = 6). Shown are representative images using a ×60 objective. Scale bar, 25 μm. Q Quantification by ELISA of the level of anti-dsDNA antibody in the serum of WT and Ccl2 KO mice (n = 13). Dots represent individual mice. *P < 0.05; **P < 0.01; ***P < 0.001.

