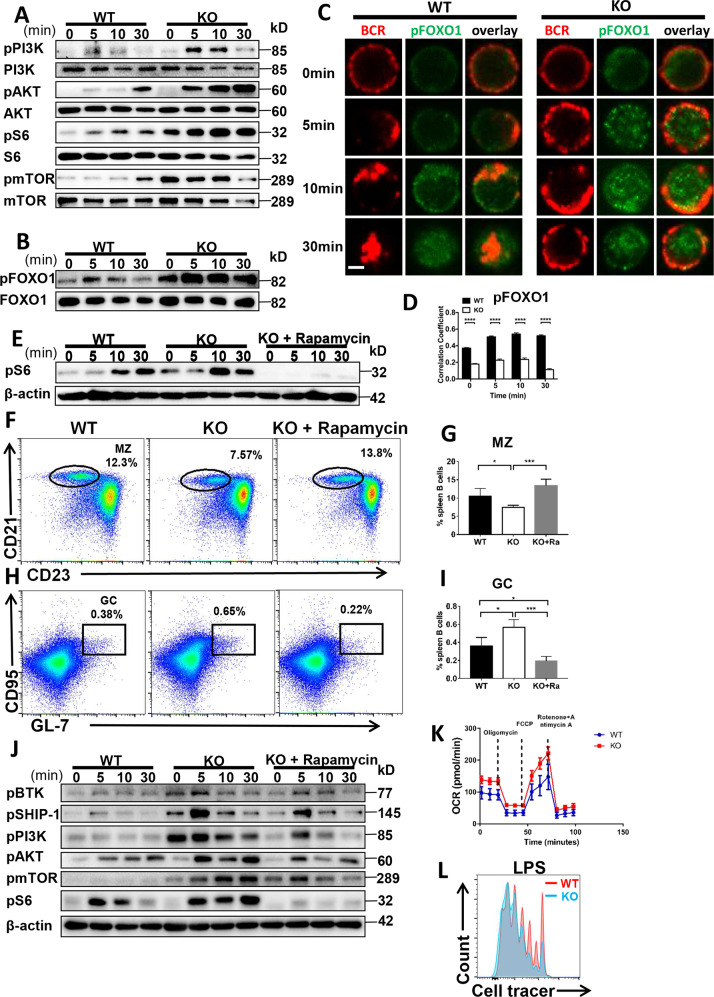
Fig. 3. CCL2 deficiency regulates the peripheral B-cell differentiation by enhancing the PI3K-AKT-mTORC1 mediated metabolic signaling pathway.
A, B Western blot of pPI3K (p85), PI3K, pAKT, AKT, pS6, S6, pmTOR, mTOR, pFOXO1, and FOXO1 levels in B cells from WT and Ccl2 KO mice stimulated with sAg for 0, 5, 10, and 30 min. Shown are representative blots from three independent experiments. C, D Splenic B cells from WT and Ccl2 KO mice were stimulated with 10 μg/ml F(ab′)2 goat anti-mouse IgG + IgM, then fixed, permeabilized and stained for pFOXO1. The colocalization between pFOXO1 and the BCR was analyzed using Pearson’s correlation coefficients. Images were captured using a Zeiss confocal fluorescence microscope. Scale bar, 2.5 μm. E Splenic B cells from 8-week-old WT and Ccl2 KO mice were treated with vehicle or rapamycin for 28 days and stimulated with sAg. The levels of pS6 were detected by western blotting. F–I Splenic lymphocytes from WT and Ccl2 KO mice (n = 4) were treated with vehicle or rapamycin for 28 days, and then analyzed for MZ and GC B cells by flow cytometry. Shown are representative dot plots and the average percentages (±SD). J Splenic B cells from WT and Ccl2 KO mice were pretreated with 20 nM rapamycin for 2 h, stimulated with sAg, and then pBTK, pSHIP-1, pPI3K, pS6, and pmTOR levels were detected by western blotting. Shown are representative blots from three independent experiments (K) OCR measurements from splenic B cells of WT and Ccl2 KO mice responding to the inhibitors: oligomycin, FCCP and rotenone plus antimycin. L Proliferation of purified splenic B cells from WT and Ccl2 KO mice at day 3 after stimulation with LPS (10 μg/ml). Data are representative of three independent experiments. *P < 0.05; **P < 0.01; ***P < 0.001; ****P < 0.0001.

