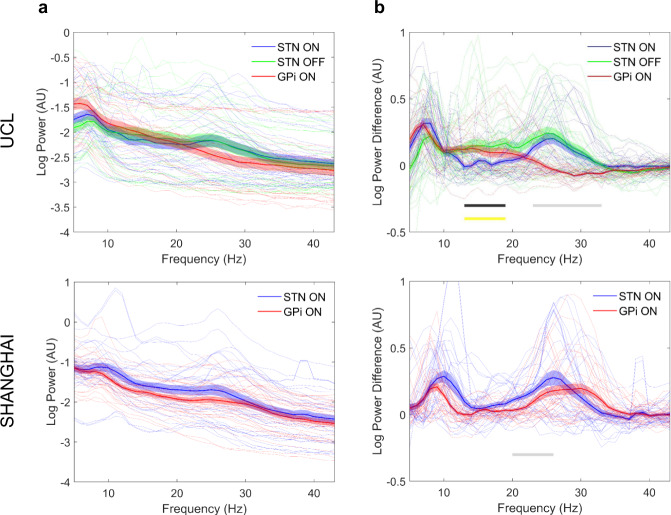
Fig. 2. Local synchrony distinguishes the STN and GPi.
Mean log spectral power for all STN (blue line—ON medication STN recording; green line—OFF medication STN recording only performed at UCL) and GPi (red line) contacts are plotted separately for the UCL (upper image) and Shanghai (lower image) cohorts in Panel A. Panel B displays the mean log power of the oscillatory component after subtraction of the aperiodic 1/f component. The shaded regions indicate standard errors of the mean. Spectral profiles of individual STN and GPi contacts are also shown in both panels by the feint blue, green, and red lines. In both structures, there are oscillatory peaks below 10 Hz. Subjects also displayed oscillatory peaks within the low (13–21 Hz) and high beta (21–30 Hz) frequency ranges. The gray line in panel B indicates regions where oscillatory power was significantly greater in the STN than in the GPi (between 23–33 Hz for the UCL cohort and between 20–26 Hz for the Shanghai cohort) in the ON medication state. In the upper image of Panel B the black line indicates regions where spectral power in the GPi exceeded spectral power in the STN in the ON medication state (13–19 Hz). Finally, also in this image, the yellow line indicates regions for the STN where power in the OFF medication state was greater than power in the ON medication state (13–19 Hz).

