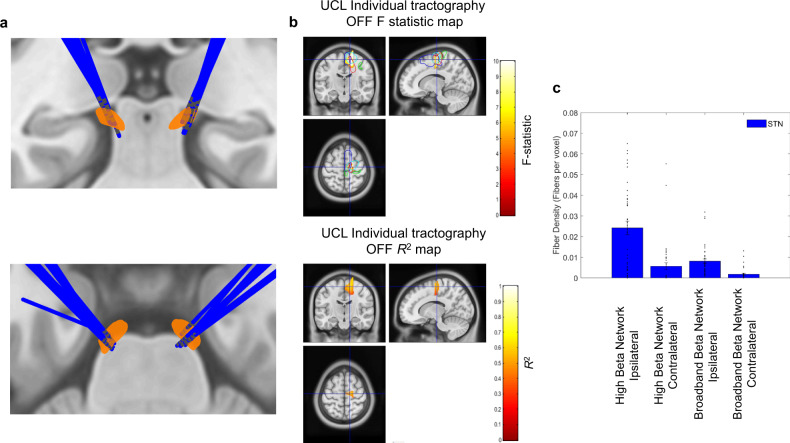
Fig. 7. Relationship between individual patient structural and individual patient functional connectivity: tract density predicts hyperdirect pathway high beta coherence.
A Electrode localization for eight STN UCL patients (patients 7–14 in Supplementary Table 1) for whom individual subject structural and functional connectomes were available. B Statistical images of significant clusters for the group level voxel-wise correlation between high beta band cortico-STN coherence and cortico-STN fiber density as per Fig. 6. The crosshairs are centered on the location of the peak F-statistic of the cluster, which lies within the SMA (blue contour). A corresponding R2 map is also shown for voxels within the cluster. C Mean tract density estimates are plotted for the ipsilateral and contralateral ‘high beta’ and ‘broadband beta’ networks. Vertical bars represent standard errors of the mean and individual data points are also shown. Data are shown for n = 8 patients (see Supplementary Table 1 and Supplementary Fig. 1 for details of electrodes and contacts that were included for each patient).

