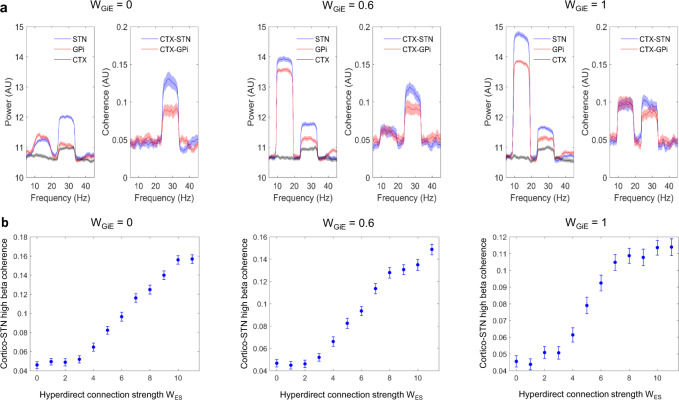
Fig. 9. Computational modeling captures observed power and coherence spectra and predicts the observed relationship between hyperdirect pathway structural and functional connectivity.
A Simulated power spectra for the STN, GPi, and cortex are shown with the associated profiles of cortico-STN and cortico-GPi coherence spectra. Parameter values for this simulation are as per Supplementary Table 2, except for the fact that the strength of the net inhibitory loop, WGIE, between the GPi, thalamus, and cortex was varied as shown. Power and coherence spectra display peaks at high and low beta frequencies, in keeping with experimental data. Increasing WGIE results in increased low beta frequency power and coherence. The shaded areas represent standard errors of the mean. B The simulated relationship between hyperdirect pathway strength and cortico-STN high beta band coherence displays a monotonically increasing profile. Standard errors of the mean are computed over n = 50 simulations.

