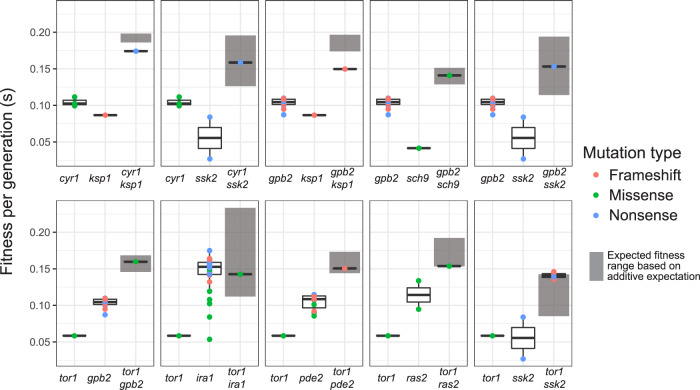
Fig. 5. Pairwise interactions among targets of selection have additive or negative effects when combined.
The additive fitness effects were estimated at gene-level for pairs of genes with adaptive alleles on the wild-type background (data from 1st-step evolution), and are annotated with gray bars, representing the 95% CI of the sum of the mean fitness of mutants in each gene. The lower and upper hinges of each box correspond to the first and third quartiles (the 25th and 75th percentiles). The bold line inside the rectangular defines the median. The whiskers extend from the hinge to a value no further than 1.5 * IQR from the hinge (where IQR is the inter-quartile range). Additive fitness effects are compared to the fitness effects of genotypes with adaptive alleles at both genes (data from 2nd-step evolutions), as a proxy for epistasis. The dot color of the double mutants refers to the second mutation shown in each graph. The first mutation matches the mutation type of the adapted ancestors (cyr1 and tor1 are missense and gpb2 is a nonsense). Calculated fitness values are provided in the Source data folder.

