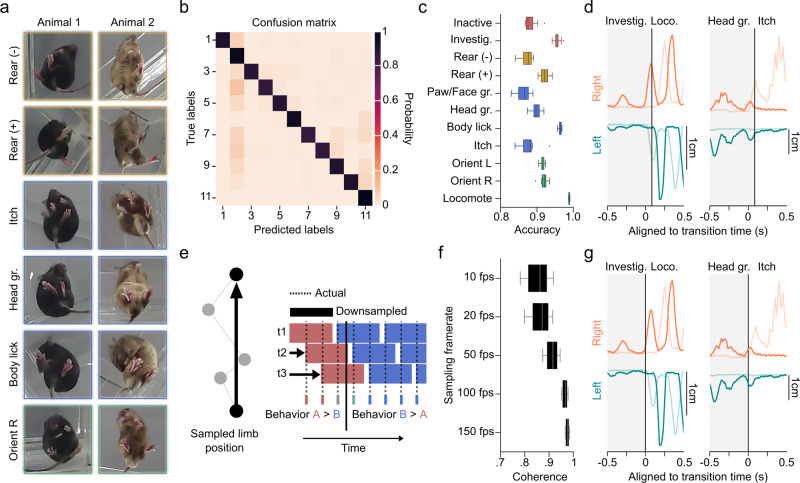
Fig. 2. Performance quantification across multiple temporal resolutions with novel machine learning algorithms.
a Snapshots of a small (Animal 1) and large (Animal 2) mouse, 300 ms into the execution of example behaviors. b Confusion matrix on the 20% held-out data. True positive predictions appear on the diagonal. c 10-fold cross-validation yield high accuracy on shuffled data across behavioral groups (21,600 data points/test), n = 6 animals. Data are presented as mean values ± SEM. d Trajectory plots of right (orange) and left (teal) limbs of the fore paw (darker) and hind paw (lighter) demonstrating example transitions from investigate to locomote, and head groom to itch. Vertical lines denote transition time as identified by basic B-SOiD analysis (10fps). e Schematized example of the potential for prediction noise in pose estimation to override the movement signal at high sampling rates. To overcome this, we executed a frameshift computation to derive high resolution transition times from downsampled, high signal data. f Percent coherence between low frequency and progressively higher resolution frameshift data. A major break occurs under for data under 50 fps, n = 1 animal. Data are presented as mean values ± SEM. g Same trajectories as in (d), now incorporating the frameshift algorithm to improve resolution of transitions. Source data are provided as a Source Data file for (b, c, f).

