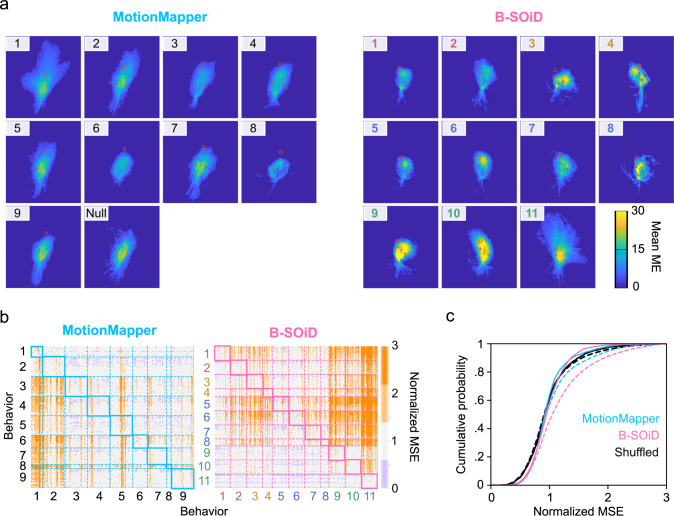
Fig. 5. Quantification of unsupervised segmentation algorithms.
a Using the same pose-estimation data, we selected up to 20 bouts from each behavioral group identified by either DLC_2_MotionMapper or B-SOiD to construct motion energy (ME) images - capturing the average amount of movement across bouts. Brighter colors indicate greater consistency in movement over the 300-600ms bouts. b To quantify the quality of these groupings, we determined the difference (MSE) in motion energy across every bout, normalizing every values along a row to that row’s in-group mean MSE. The comparison between related, in-group bouts is shown in the highlighted diagonal. Darker orange indicates greater differences between those pairs of bouts, e.g. 2 = twice the normalized MSE. B-SOiD behavior numbers as used in Fig 1c. c Cumulative histograms of values in (b) for in-group (solid line) and out-group (dashed line) bouts. The same B-SOiD bouts were shuffled into 11 random groups (black) to demonstrate a distribution without structure. Right-shifting of the distribution is indicative of increased differences between sample bouts. Source data are provided as a Source Data file for (b, c).

