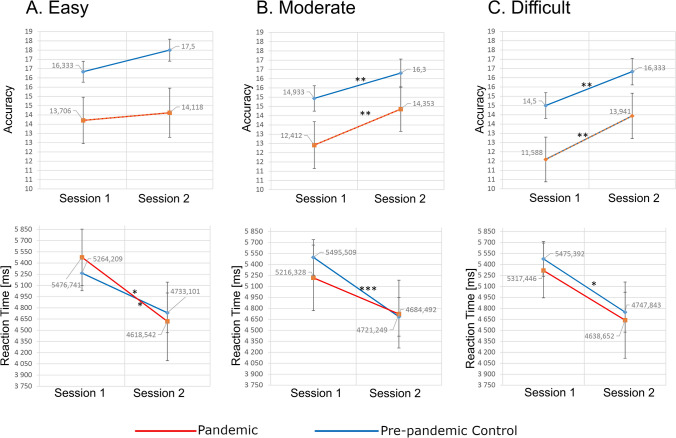
Figure 4.
Accuracy and reaction times in a transitive reasoning task. Mean accuracies (upper row) and mean reaction times (lower row) results for Pandemic and Pre-pandemic Control groups in the easy (A), moderate (B) and difficult (C) task variants. The stars above lines joining results of Sessions-1 and Session-2 denote significant differences (*p < 0.05; **p < 0.01; ***p < 0.001) of Chi2 post-hoc test followed by Friedman’s test.). Created using JASP 0.14.1 (https://jasp-stats.org).

