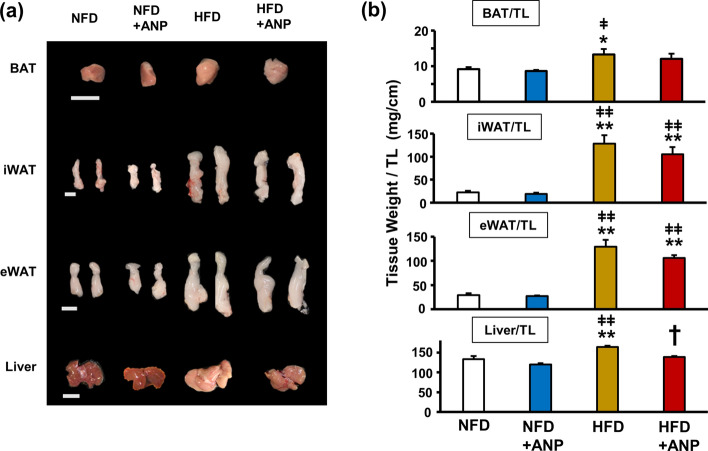
Figure 2.
Macroscopic appearances and weights of the adipose tissues and the liver. The representative images (a) and weight (b) of each tissue harvested from the indicated mice at three weeks after treatment with or without ANP (n = 6 each). Bars = 1 cm. Data are mean ± SEM. *P < 0.05 and **P < 0.01 versus NFD; †P < 0.05 versus HFD; ǂP < 0.05 and ǂǂP < 0.01 versus NFD + ANP. BAT, brown adipose tissue; iWAT, inguinal white adipose tissue; eWAT, epididymal white adipose tissue.

