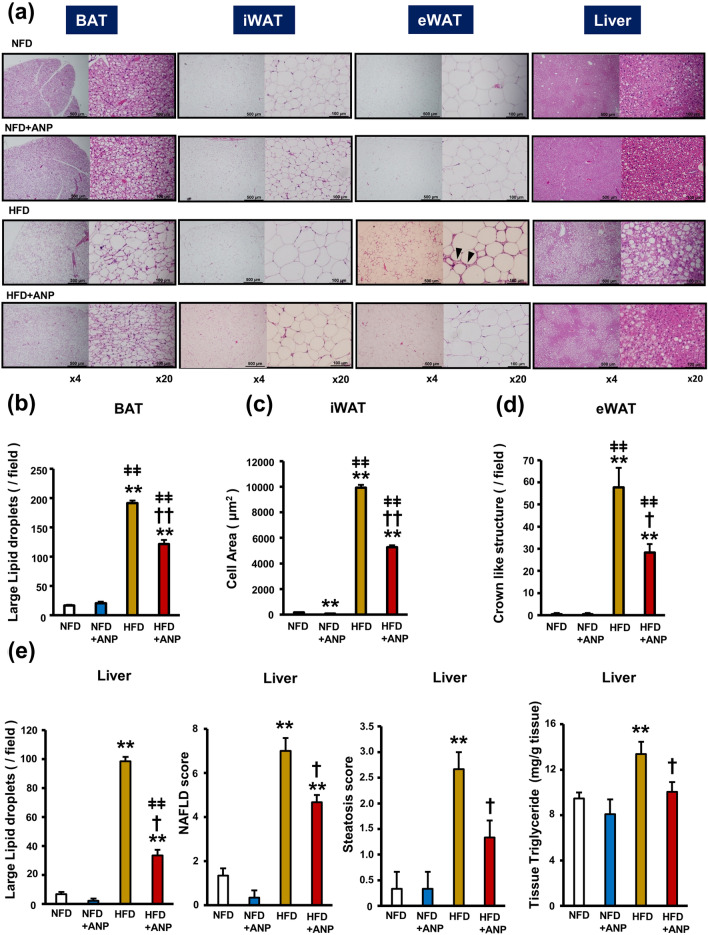
Figure 3.
Effects of ANP treatment on HFD-induced enlargement of lipid droplets and inflammation in adipose tissues and hepatic steatosis. (a) Representative histological images (hematoxylin–eosin staining) of each tissue harvested from the indicated mice at three weeks after treatment with or without ANP (n = 3 each). The images were captured at a field lens magnification of × 4 (left, bars = 500 μm) and × 20 (right, bars = 100 μm). The arrow heads indicate crown-like structures. (b) The number of large lipid droplets (> 100µm2)/field in BAT (field lens × 20, n = 3 each). (c) The cell area/field in iWAT (field lens × 20, n = 3 each). (d) The number of crown like structures/field in eWAT (field lens × 4, n = 3 each). (e) The number of large lipid droplets (> 100µm2)/field in liver (field lens × 20, n = 3 each). NAFLD score and steatosis score calculated in each group (n = 3 each). Triglyceride content in the hepatic tissues (n = 5 each). Data are mean ± SEM. *P < 0.05 and **P < 0.01 versus NFD; †P < 0.05 and ††P < 0.01 versus HFD; ǂP < 0.05 and ǂǂP < 0.01 versus NFD + ANP.

