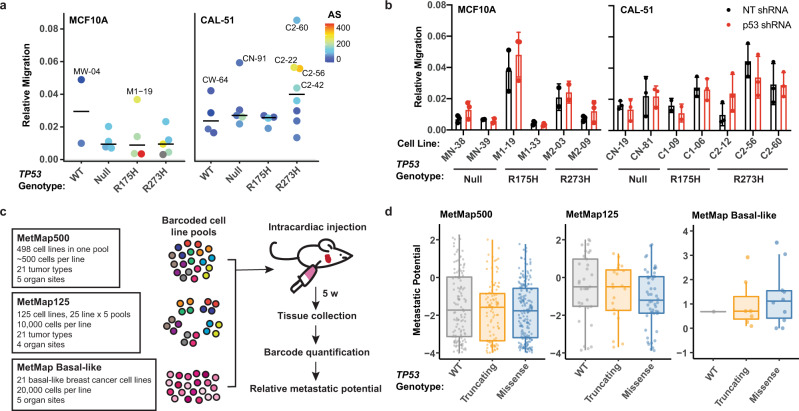
Fig. 6. Metastatic phenotypes are associated with aneuploidy and not mutant p53 expression.
a Quantification of the relative migration (mean cells per field from three technical replicates normalized to the number of cells seeded, arbitrary units) of MCF10A (left) and CAL-51 (right) cells that crossed the membrane in transwell assays. Each dot represents the mean relative migration for each cell line (MCF10A n = 2 WT, 4 Null, 4 R175H, and 5 R273H cell lines; CAL-51 n = 4 WT, 5 Null, 4 R175H, and 8 R273H cell lines) from at least two independent experiments. Bars represent the median value per TP53 genotypes. Dots are colored by aneuploidy score, and those colored in gray were not profiled in cytogenomic microarray experiments. b Quantification of relative migration, as described above, in MCF10A (left) and CAL-51 (right) cells containing nontargeting (NT, black) or p53 shRNAs (red). Mean ± s.d. from n = 3 independent experiments (except MN-39, M2-03, and C1-09 cell lines, n = 2). Western blots showing knockdown of p53 are shown in Supplementary Fig. 7b, c. c Diagram demonstrating workflow for metastatic datasets generated in the MetMap project55. d Box and whisker plots of the metastatic potential in cells with wild-type (WT), missense or truncating mutations in TP53 in the MetMap500 (left; WT n = 129, Truncating N = 101, Missense N = 195), MetMap125 (middle; WT n = 33, Truncating N = 20, Missense N = 50) and MetMap Basal-like (right; WT n = 1, Truncating N = 7, Missense N = 10) datasets. Points represent mean metastatic potential across all sites. Boxplot elements: center line, median; box limits, upper and lower quartiles; whiskers, 1.5× interquartile range. Significance tested using a one-way analysis of variance (ANOVA) with Dunnett’s multiple comparisons test, d two-way ANOVA with Sidak’s multiple comparisons test, and c one-way ANOVA with Tukey’s multiple comparison test. Source data are provided in the Source Data File.

