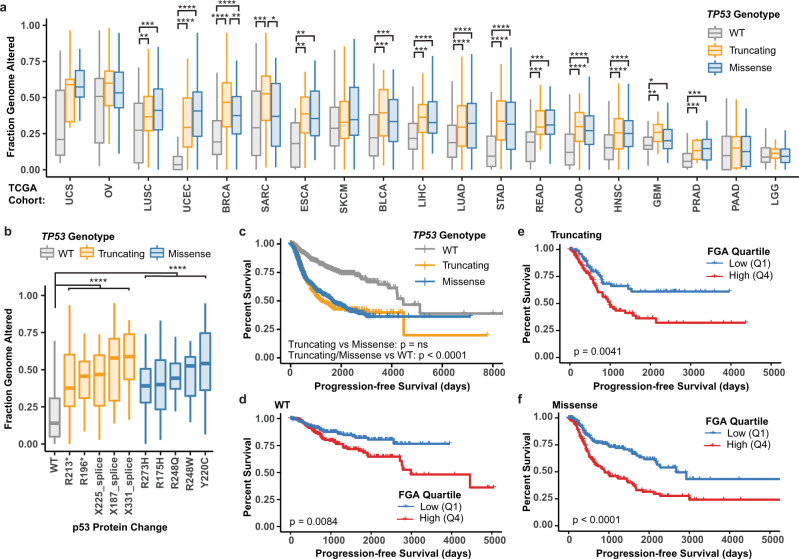
Fig. 7. Aneuploidy and loss of p53 function associate with unfavorable prognosis.
a, b Box and whisker plots of the fraction of the genome altered (FGA) in tumors with wild-type (WT), missense or truncating mutations in TP53 compared a across cancer types (source: The Cancer Genome Atlas [TCGA]), or b in BRCA, OV, UCEC, UCS, and LUSC cancer types across the five most frequent truncating or missense mutations. Cohort acronyms, values for n, and exact P values can be found in Supplementary Table 3 or the Source Data file. Pairwise two-sided Wilcoxon test with Benjamini–Hochberg P-value correction, *P < 0.05, **P < 0.01, ***P < 0.001, ****P < 0.0001. Boxplot elements: center line, median; box limits, upper and lower quartiles; whiskers, 1.5× interquartile range. c–f Kaplan–Meier curves showing progression-free survival of individuals with BRCA, OV, UCEC, UCS, and LUSC separated by TP53 genotype (c) or further divided into aneuploid-low (blue, lower quantile FGA, Q1) or aneuploid-high (red, upper quantile FGA, Q4) groups in individuals with tumors containing WT (d), truncating (e), or missense (f) mutant TP53. Log-rank tests. Source data are provided in the Source Data File.

