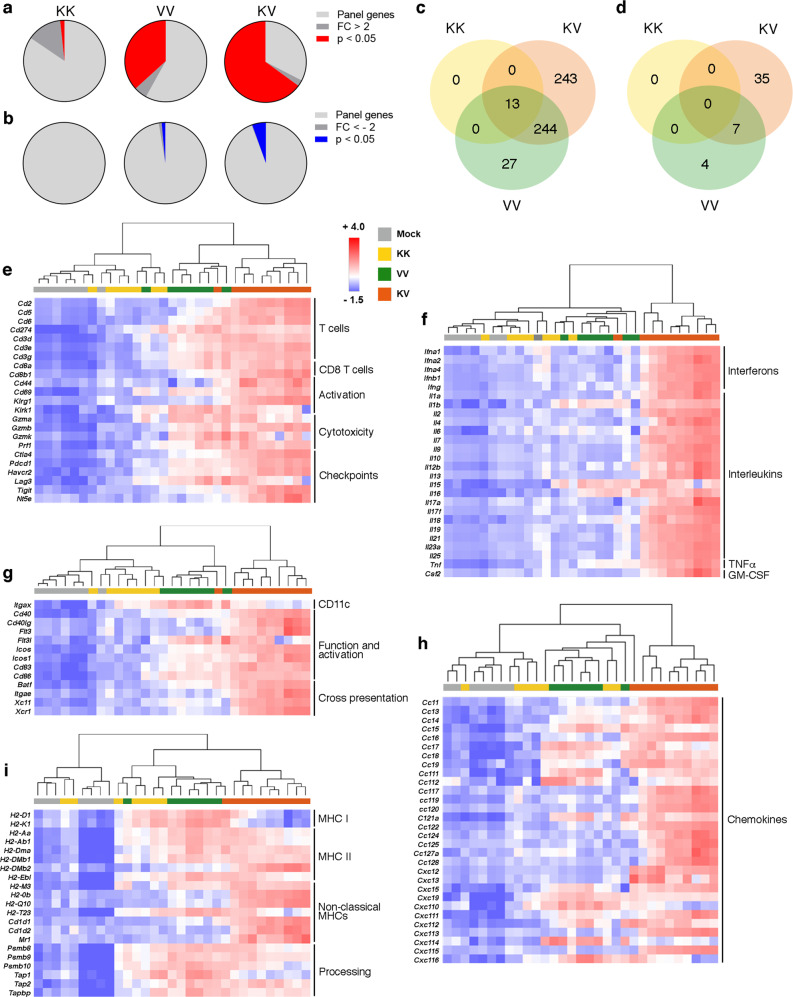
Fig. 3. Gene signatures after heterologous vaccination indicate strong immune activation in treated tumors.
a–i C57BL/6 J mice bearing TC-1 tumors were immunized as in Fig. 2 or left untreated (mock). Tumors were harvested on day 23 post tumor implantation for transcriptome analysis using NanoString® technology (n = 7 for mock, KK, and VV, n = 10 for KV). a, b Gene expression in TC-1 tumors from each vaccination group was normalized to mock tumors and the proportion of (a) significantly upregulated (fold change [FC] >2 and p < 0.05) and (b) significantly downregulated (negative reciprocal of FC < −2 and p-value < 0.05) genes is displayed. c, d Venn diagrams depict the total number of significantly (c) upregulated and (d) downregulated genes after different vaccine regimens and the overlap between each gene set. e–i Heatmaps display relative gene expression as z-scores (scaled to each gene) and hierarchichal clustering (Euclidean distance, average linkage) was applied to sample data with each column representing one individual tumor. Expression of typical genes associated with (e) cytotoxic T cells, (f) cytokines, (g) dendritic cells, (h) chemokines and (i) antigen presentation is shown. 7–10 mice analyzed for each treatment group, p-values were calculated using two-tailed t test and false discovery rate (FDR) adjusted p-values calculated using Benjamini–Yekutieli procedure are reported. The study as shown was performed once. Groups mock and KV were repeated in a separate study. Source data are provided in the Source Data File.

