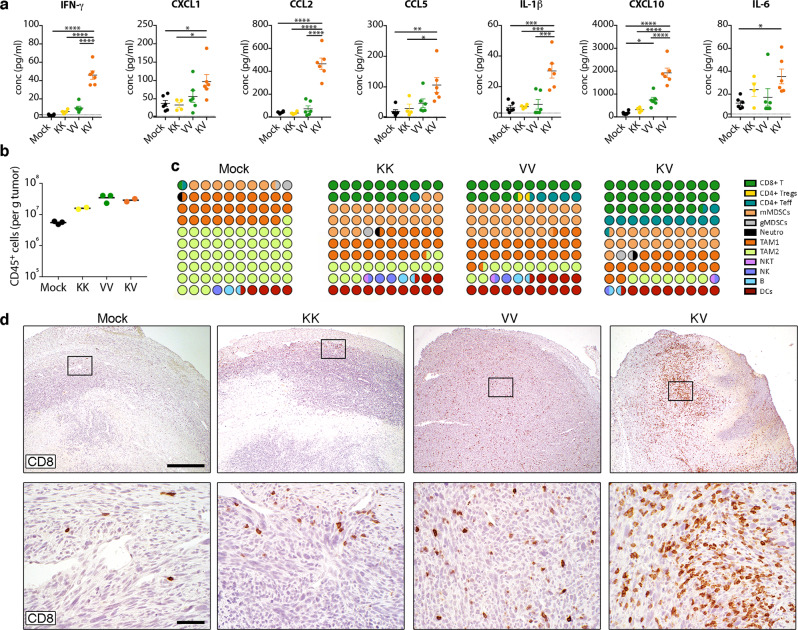
Fig. 4. Remodeling of immunosuppressive tumor microenvironment (TME) after heterologous prime-boost vaccination.
Mice bearing palpable TC-1 tumors were immunized as in Fig. 2. a Cytokine and chemokine levels in plasma were quantified on day 15 and are shown as mean ± SEM (n = 6 for mock, VV, and KV, n = 4 for KK). One-way ANOVA with Tukey’s multiple comparison (*p < 0.05, ** p < 0.01; ***p < 0.001, ****p < 0.0001). Dotted lines indicate the limit of quantification. b, c Tumors were harvested on day 26 and tumor-infiltrating leukocytes were characterized by flow cytometry (n = 3 for mock and VV, n = 2 for KK and KV). b Total CD45+ leukocytes (mean) and (c) relative proportions of various immune cell subsets among all leukocytes is shown. d Representative immunohistochemistry images show T cell infiltration (CD8) in TC-1 tumors day 23 post tumor implantation after different vaccinations. Lower panel shows higher magnification view of boxed area from upper panel. Scale bars: 500μm upper row, 50 μm lower row. Study (a) was performed twice, studies (c, d) were performed once. Source data and p-values are provided in the Source Data File.

