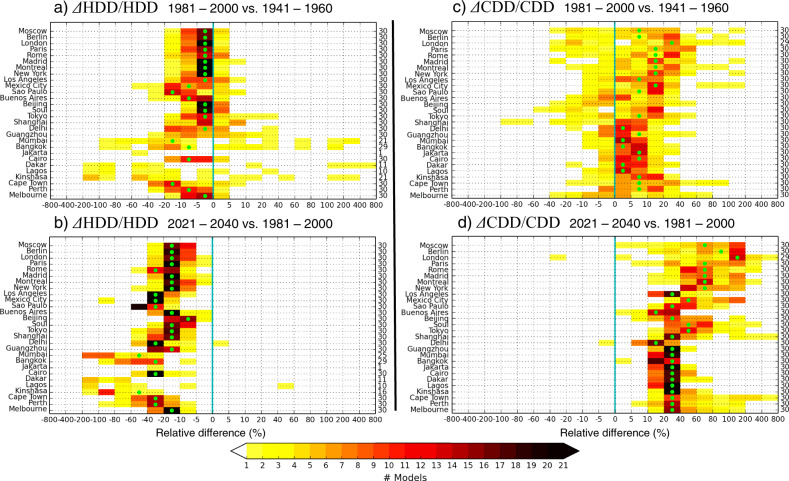
Fig. 3. Inter-model variability of climate-driven trends in energy demand for heating and cooling buildings at selected cities.
Trends are expressed as relative differences in annual Heating Degree-Days (HDD) and Cooling Degree-Days (CDD), calculated for each of the 30 CMIP5 simulations. Relative difference in HDD (ΔHDD/HDD) between the (a) 1981–2000 and 1941–1960 averages, and (b) the 2021–2040 and 1981–2000 averages; relative difference in CDD (ΔCDD/CDD) between the (c) 1981–2000 and 1941–1960 averages, and the (d) 2021–2040 and 1981–2000 averages. Differences are given in % relative to the earlier period. Projections are based on the RCP8.5 scenario. The color bar denotes the number (#) of models in each range of relative change. The multi-model mean falls in the range marked by the green dots. Numbers on the right indicate the number of models for which the difference between the two periods is significant. The vertical blue line marks zero.

