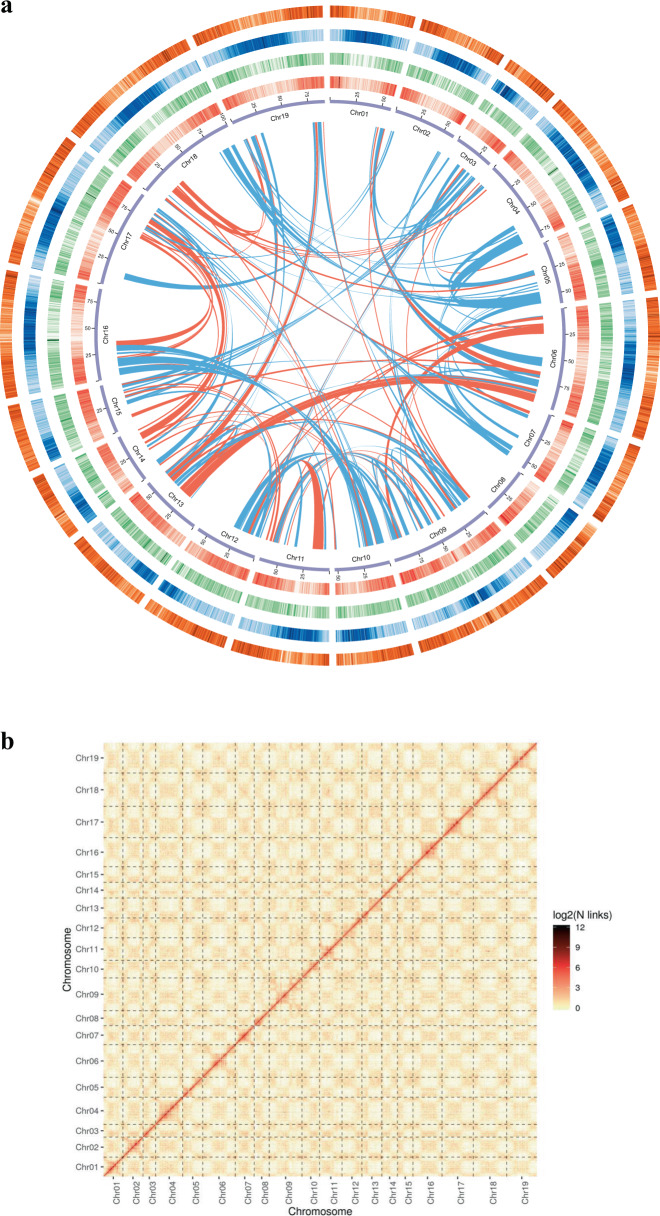
Fig. 2. Chromosomal features and intensity signal heat map of D. chrysotoxum chromosomes according to Hi-C output.
a From inside outward: chromosome (purple), gene density (red), DNA type repeat sequence density (green), copy density (blue), and gypsy density (orange). All the data are shown with sliding windows of 500 kb, and the inner lines (green indicates the positive direction, and red indicates the opposite direction) represent syntenic blocks on homologous chromosomes. b Heat map of the intensity of the Hi-C chromosome. The heat map represents the contact matrices generated by aligning the Hi-C data to the chromosome-scale assembly of the D. chrysotoxum genome. A higher value on the scale bar indicates a higher contact frequency

