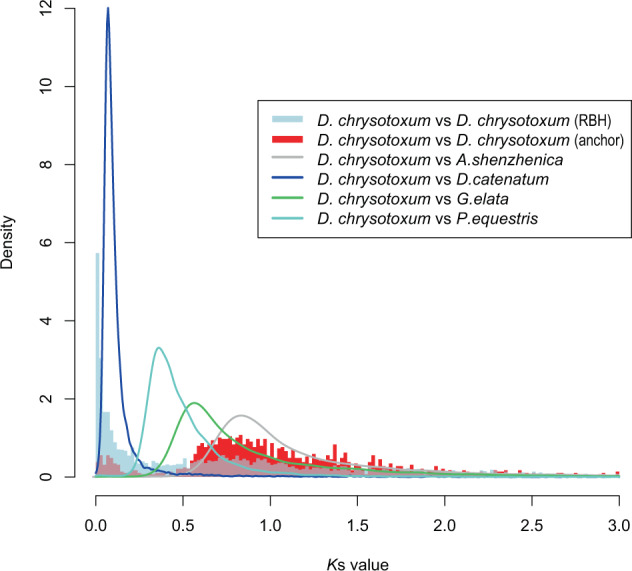
Fig. 5. Distribution of Ks values in the whole paranome of D. chrysotoxum.

The Ks distributions of paralogs using the reciprocal best hit (RBH) and anchor are shown as light blue and red histograms, respectively. The Ks distribution for the one-to-one orthologs of D. chrysotoxum–G. elata, D. chrysotoxum–A. shenzhenica, D. chrysotoxum–D. catenatum, and D. chrysotoxum–P. equestris are shown as green, gray, blue, and cyan curves, respectively. RBH reciprocal best blast hit; “anchor” refers to colinear regions
