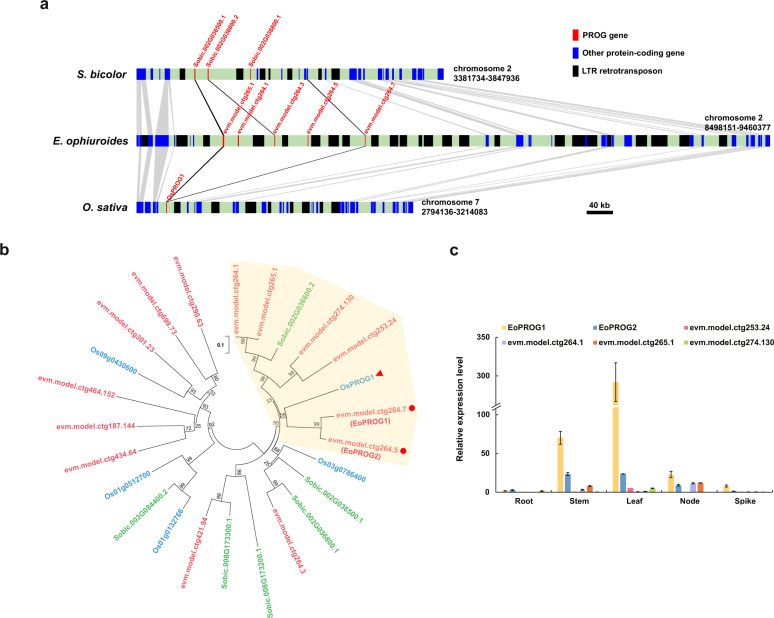
Fig. 4. Screening and analysis of candidate PROG genes for prostrate growth.
a Collinearity analysis of chromosome segments containing PROG homologs in O. sativa, S. bicolor, and E. ophiuroides. The red, blue, and black boxes indicate PROG genes, other protein-coding genes, and LTR retrotransposons, respectively. The gray region represents the shared collinear sequence. Black lines indicate the orthologous relationships of PROG genes. b Phylogenetic tree of PROG proteins. The gene IDs in blue represent the OsPROG1 gene (indicated by the red triangle) and its homologs in O. sativa. The gene IDs in green represent the homologs of the OsPROG1 gene in S. bicolor. The gene IDs in red represent the homologs of the OsPROG1 gene in E. ophiuroides. The red dots indicate the closest genetic relationships between candidate PROG genes and OsPROG1 in rice. The yellow area shows that one homologous gene in S. bicolor and six homologous genes in E. ophiuroides exhibited close genetic relationships with OsPROG1 in rice. c The expression patterns of six candidate PROG genes of E. ophiuroides in roots, stems, leaves, nodes, and spikes

