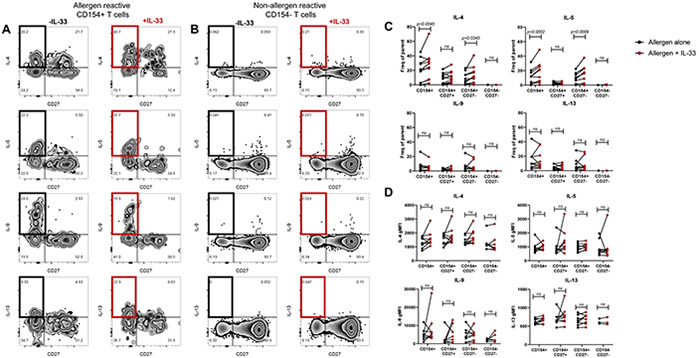
Figure 4: Enhanced TH2 effector function of total allergen reactive and allergen reactive CD27− cells with IL-33.
A: FACS plots showing TH2 cytokine-expressing allergen reactive cells with allergen alone (left), and allergen + IL-33 (right). B: FACS plots showing TH2 cytokine-expressing non-allergen reactive cells with allergen alone (right) and allergen + IL-33 (right). C: Graphical depictions of TH2 cytokine secretion +/− IL-33 within the indicated subpopulations. D: Graphical depictions of TH2 cytokine MFI values +/− IL-33 within the indicated subpopulations. Statistics computed with the 2-way ANOVA followed by Sidak’s multiple comparisons test.

