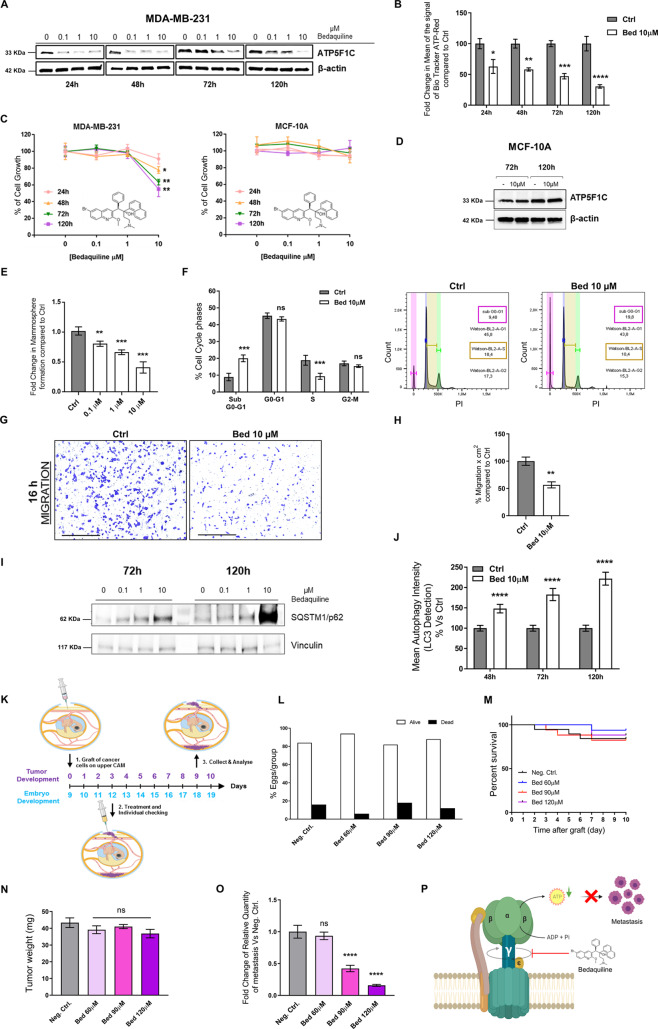
Fig. 7. Targeting ATP5F1C with Bedaquiline prevents mitochondrial ATP production, cell migration, 3D anchorage-independent growth, and metastasis in vivo.
A Bedaquiline downregulates the expression of ATP5F1C. MDA-MB-231 2D cell monolayers were treated with Bedaquiline (0, 0.1, 1, and 10 μM) and the expression of ATP5F1C was assessed by Western blot analysis at 4-time points (24, 48, 72, and 120 h of incubation). Note that the levels of ATP5F1C protein expression were reduced in a sustained way, especially at 10 μM Bedaquiline, relative to vehicle-alone (DMSO) controls. B Bedaquiline reduces mitochondrial ATP production. Note that Bedaquiline significantly inhibited ATP production in MDA-MB-231 cells, at a concentration of 10 μM, in a time-dependent manner, as assessed using Biotracker ATP-Red 1, to specifically detect ATP levels. Maximal inhibition of 75% was observed at 120 h of treatment. Two-way ANOVA, Sidak’s multiple comparisons test, *p < 0.05, ** p < 0.005, ***p < 0.0005, ****p < 0.0001. C Bedaquiline-induced ATP depletion reduces 2D monolayer cell growth in MDA-MB-231 cells, but not in MCF10A cells. Note that Bedaquiline effectively inhibits 2D growth in MDA-MB-231 cells, in a time-dependent manner, at a concentration of 10 μM. No effect was observed in MCF10A, which is a non-tumourigenic human mammary epithelial cell line. Unpaired t test, *p < 0.05, ** p < 0.005. D Bedaquiline does not reduce ATP5F1C expression in MCF-10A cells. MCF-10A cell monolayers were treated with Bedaquiline (10 μM) and the expression of ATP5F1C was assessed by Western blot analysis at the 2-time points: 72 and 120 h of incubation. Note that the levels of ATP5F1C protein expression were not reduced after 72 and 120 h of treatment with 10 μM Bedaquiline, relative to vehicle-alone (DMSO) controls. E ATP depletion inhibits 3D mammosphere formation, in a concentration-dependent manner. Note that Bedaquiline effectively blocks 3D mammosphere formation in MDA-MB-231 cells by ~65% at a concentration of 10 μM. One-way ANOVA, Dunnett’s multiple comparisons test, **p < 0.005, ***p < 0.0005. F ATP depletion inhibits DNA-synthesis and induces cell death: quantitation and representative FACS tracings. Note the twofold reduction of MDA-MB-231 cells in the S-phase and the concomitant twofold increase in the sub-G0–G1 population, after 120 h of treatment. Two-way ANOVA, Sidak’s multiple comparisons test, ns = not significant, ***p < 0.0005. Representative FACS tracings and Watson analysis of the cell cycle are shown. G, H ATP-depletion inhibits cell migration: Representative images (G) and quantitation (H). Note that Bedaquiline blocks MDA-MB-231 cell migration by ~50%. MDA-MB-231 cells were cultured in presence of Bedaquiline (10 μM) for 32 h and moved to Transwells for 16 h in the presence of Bedaquiline (10 μM). Representative images are shown. Scale bar = 500 μm. Unpaired t test, **p < 0.005. I–J ATP depletion using Bedaquiline induces autophagy in MDA-MB-231 cells. I MDA-MB-231 2D cell monolayers were treated with Bedaquiline (0, 0.1, 1, and 10 µM) and the expression of SQSTM1/p62 was assessed by Western blot analysis at 72 and 120 h. Note that the levels of SQSTM1/p62 protein expression were increased in a sustained way, especially at 10 µM Bedaquiline, relative to vehicle-alone (DMSO) controls. J Note that Bedaquiline increases the LC3B content in MDA-MB-231 cells. Autophagy Intensity was measured using the Autophagy LC3-antibody-based Kit for Guava® Muse® Cell Analyzer by Luminex. Cells were treated with Bedaquiline (10 µM) or vehicle alone, for 48, 72, and 120 h, and then subjected to analysis by flow cytometry. We observed an increase of LC3B content in Bedaquiline treated cells, based on the intensity of the signal. The analysis was conducted on 10,000 cells. Data represent the mean fold change ± SD over control (vehicle alone; DMSO) cells, n = 3. Two-way ANOVA, Sidak’s multiple comparisons test, **p < 0.005, ****p < 0.0001. K CAM assay for quantitating in vivo tumor growth, metastasis and toxicity. An inoculum of 1 × 10⁶ MDA-MB-231 cells was added onto the CAM of each egg (day E9) and then eggs were randomized into groups. On day E10, tumors were detectable, and they were then treated daily for 8 days with vehicle alone (1% DMSO in PBS) or Bedaquiline. After 8 days of drug administration, on day E18 all tumors were weighed, and the lower CAM was collected to evaluate the number of metastatic cells, as analyzed by qPCR with specific primers for Human Alu sequences. Before each drug administration, treatment tolerability was evaluated by scoring the number of live and dead chicken embryos. L, M Bedaquiline toxicity using the CAM assay: Live vs. Dead Assay (L) and % Survival (M). Note that Bedaquiline is non-toxic, relative to the vehicle-alone control. N ≥ 14 per group. N Tumor growth. Note that Bedaquiline has no significant effects on tumor growth in vivo. N ≥ 14 per group. One-way ANOVA, Dunnett’s multiple comparisons test, ns = not significant. O Metastasis. Note that Bedaquiline progressively inhibited spontaneous metastasis in vivo, in a dose-dependent manner, with a maximum inhibition of 84% at 120 μM. N ≥ 7 per group. One-way ANOVA, Dunnett’s multiple comparisons test, ns = not significant, ****p < 0.00005. P Schematic summary diagram. Bedaquiline, an FDA-approved drug, effectively inhibited mitochondrial ATP production and metastasis in vivo, by targeting the gamma subunit (ATP5F1C) of the mitochondrial ATP-synthase.

