FIGURE 2.

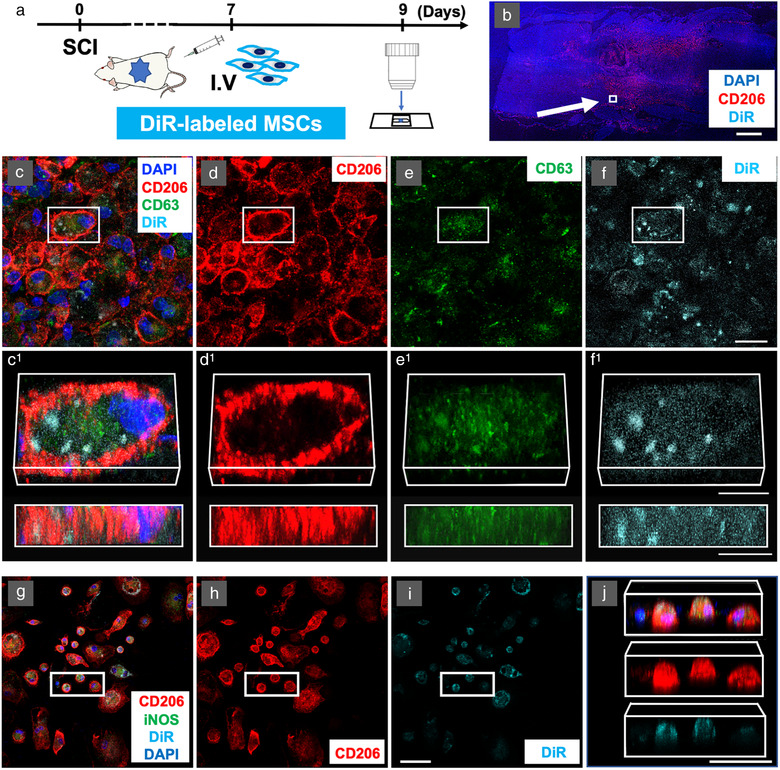
M2 macrophages take up DiR‐labeled MSC‐sEVs in vivo at the lesion site after intravenous infusion of DiR‐labeled MSCs and in vitro after exposure to DiR‐labeled MSC‐sEVs. a, Experimental protocol for tracking the MSC‐sEVs released from IV infused DiR‐labeled MSCs in vivo. b, Confocal micrographs of a representative region of a frozen sectioned contused spinal cord harvested 48 h after IV infusion of DiR‐labeled MSCs, immunostained with antibodies directed against M2 macrophage marker CD206 (red) and DAPI (blue). Scale bars indicate 100 μm. c‐f, Images of a representative region of the white square in the figure. c, immunostained with antibodies directed against CD206 (red) and exosomes marker CD63 (green) counterstained with DAPI (blue) with DiR visualized as cyan. Images from left to right show the same area showing fluorescence channels for c, CD206, CD63, DAPI, & DiR, d, CD206, e, CD63, and f, DiR. Images in c1‐f1 show enlarged images of the boxed area above rotated and illustrated in 3D. Note the strong co‐localization of DiR fluorescence with CD206, suggesting that the majority of these DiR hotspots were localized within CD206+ M2 macrophages. Scale bars in c‐f and c1‐f1 indicate 20 μm and 10 μm, respectively. Note that although the labelled MSCs themselves were not detected at the lesion site DiR‐ labelled hotspots co‐staining with exosome markers were. g‐j Confocal micrographs of a representative region of rat bone marrow macrophage cultures stimulated to induce a phagocytic M2 phenotype with IL‐4 and central myelin enriched fraction and fixed 24 h after the addition of DiR‐labeled MSC‐sEVs at pH = 6. Cultures were stained with antibodies directed against CD206 (red), iNOS (green), and counterstained with DAPI (blue) with DiR fluorescence visualized as Cyan. Images from left to right show: (g) CD206, iNOS, DAPI, & DiR, (h) CD206 & DiR, (i) DiR only, and (j) rotated 3D reconstructions of the boxed area indicated in (g‐j) containing 3 CD206+ presumptive M2 macrophages and one CD206– and iNOS– presumptive M0 macrophage (left). Note that the two cells in the centre of the group appear largely filled with DiR fluorescence hotspots, while both the cells on the left and on the right do not appear to have taken up significant quantities of exosomes. Scale bars in (i) and (j) indicate 50 μm. MSC: mesenchymal stem/stromal cell, MSC‐sEVs: small extracellular vesicles derived from MSCs, DiR: DilC18(7);1,1′‐dioctadecyl‐3,3,3′,3′‐tetramethylindotricbocyanine iodide, DAPI: 4′,6‐diamidino‐2‐phenylindole, iNOS: inducible nitric oxide synthase
