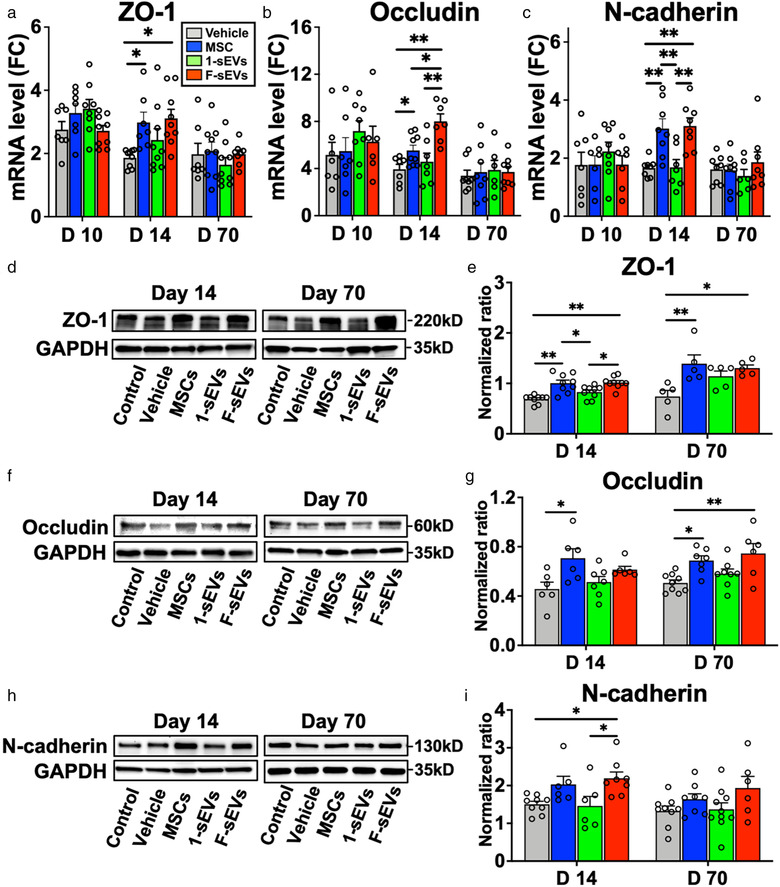
FIGURE 7.

Both infusion of MSCs and fractionated MSC‐sEVs dosing promote increases of tight and adherens junction proteins. a‐c, Graphs showing qRT‐PCR analysis of relative mRNA expression levels of ZO‐1 (a), occludin (b), and N‐cadherin (c). [ΔCT was calculated against GAPDH control, and ΔΔCT (mRNA level) was calculated against the ΔCT of the control.] Note significant increases were observed in ZO‐1, occludin, and N‐cadherin mRNA in both the MSC and F‐sEVs treatment groups relative to the Vehicle groups at 14‐day post‐SCI. d‐i, Representative images of western blots and quantitative density analysis of the lesion sites harvested at 14‐ and 70‐day post‐SCI, showing levels of ZO‐1 (d and e), occludin (f and g), and N‐cadherin (h and i). Note that levels ZO‐1, occludin, and N‐cadherin were all significantly increased in the MSC treated condition and levels of ZO‐1 and N‐cadherin levels were significantly increased in the F‐sEVs treatment condition relative to the Vehicle treated condition at 14‐day post‐SCI. Animals in both the MSC and F‐sEVs treatment conditions also showed increases in ZO‐1 and occludin protein levels at 70‐day post‐SCI. Values are presented as means ± SEM. A 1‐way ANOVA followed by the Tukey‐Kramer test or the Kruskal‐Wallis test followed by the Steel‐Dwass test was conducted. *: P < .05, **: P < .01, MSC: mesenchymal stem/stromal cell, MSC‐sEVs: small extracellular vesicles derived from MSCs, ΔCT: delta‐cycle threshold, SCI: spinal cord injury, GAPDH: Glyceraldehyde 3‐phosphate dehydrogenase, FC: fold change
