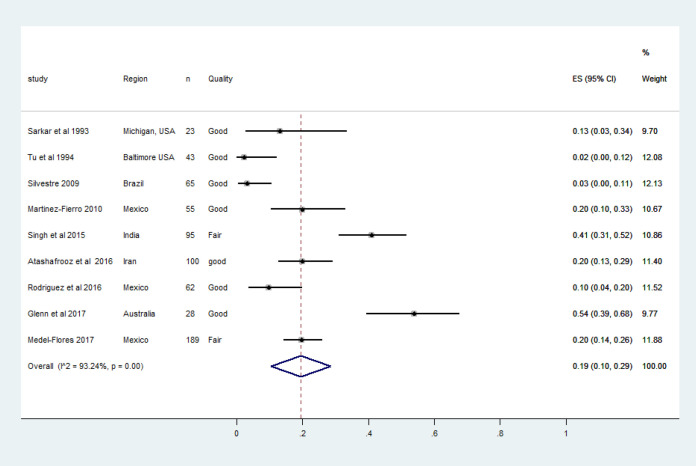
Figure 5.
The Forest Plot of Pooled HPV Prevalence in Histologically Confirmed Prostate Cancer Cases. Squares specify the effect sizes of individual studies and extended lines denote 95% confidence intervals (CI). Sizes of square imply the weight of studies based on sample size using a random effects analysis. The diamond data indicates pooled prevalence. CI, confidence interval

