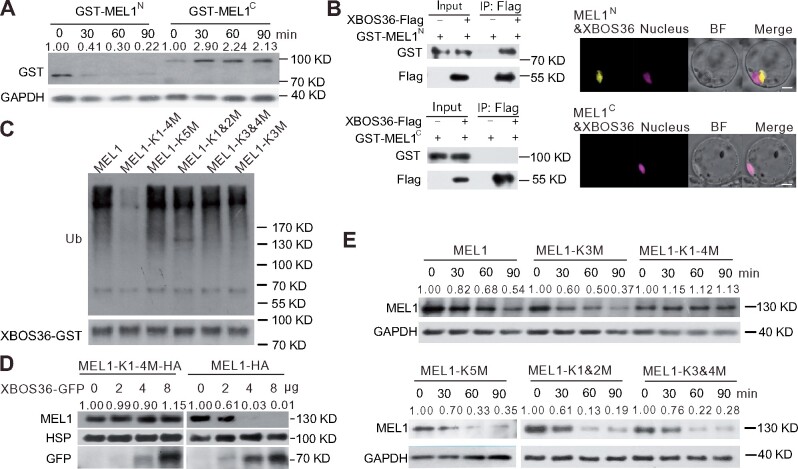
Figure 6.
The N terminal of MEL1 is responsible for its degradation and its interaction with XBOS36. A, Stability of GST-MEL1N and GST-MEL1C in protein extracts from rice panicles. E. coli-expressed GST-MEL1N and GST-MEL1C proteins were purified by GST resin and incubated with plant protein extracts prepared from rice panicles at the MS. GAPDH was used as a control. The GST-MEL1N and GST-MEL1C densitometric ratio was recorded by ImageJ. The relative abundance of GST-MEL1N and GST-MEL1C at 0 min was set to 1, respectively. B, XBOS36 interacts with N terminal fragment of MEL1 in pull-down and BiFC assays. Recombinant GST-MEL1C, GST-MEL1N, and XBOS36-Flag proteins purified from E. coli were incubated in tubes as indicated, followed by pull-down with resin. The proteins in the eluate were detected using anti-GST and anti-FLAG antibodies. BiFC signals were detected after overnight culture by confocal microscopy. Red fluorescence indicates nuclear signal, and yellow fluorescence indicates positive interactions. Scale bar, 5 µm. C, The K1–4M version of MEL1 failed to be ubiquitinated by GST-XBOS36. D, Stability of MEL1-HA and K1-4 to R-mutated version of MEL1 protein in protoplasts transfected with different amounts (0, 2, 4, and 8 μg) of ProUbi:XBOS36-GFP plasmids. HSP90 was used as a control. The MEL1 densitometric ratio was recorded by ImageJ. The relative abundance of MEL1-HA and MEL1-K1-4M-HA transfected with 0 μg XBOS36-GFP was set to 1, respectively. E, Stability of different K to R-mutated versions of MEL1 in protein extracts from rice panicles. The upper blots showed the K3(MEL1-K3M) or K1-4 (MEL1-K1-4M) to R-mutated MEL1 proteins; the lower blots showed the K5(MEL1-K5M), K1&2(MEL1-K1&2M), or K3&4(MEL1-K3&4M) to R-mutated MEL1 proteins. E. coli-expressed K to R-mutated MEL1 proteins were purified by GST resin and then incubated with plant protein extracts prepared from rice panicles at the MS for the indicated times (0, 30, 60, and 90 min). GAPDH was used as a control. The MEL1 densitometric ratio was recorded by ImageJ. The relative abundance of different versions of MEL1 at 0 min was set to 1, respectively.

