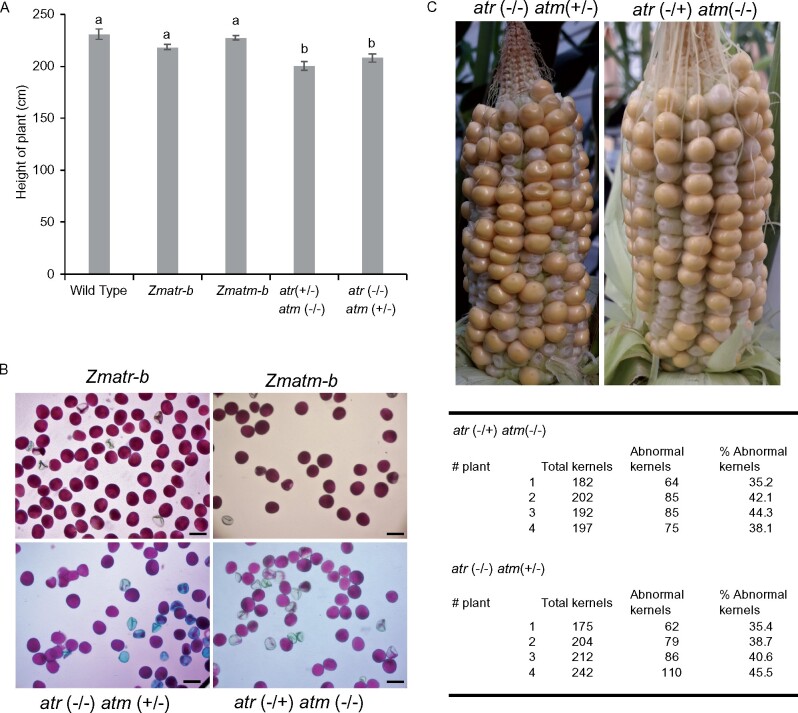
Figure 10.
Vegetative and reproductive phenotypes of atm (+/−) atr (−/−) and atm (−/−) atr (+/−) sesquimutant plants. A, Height of plants of WT, Zmatr-b and Zmatm-b single mutants, and atm (+/−) atr (−/−) and atm (−/−) atr (+/−) sesquimutants. Height was measured from the soil up to the top tassel. Values are average ± se; n = 4–5. Letters on the bars indicate statistically different means (P < 0.05, ANOVA mixed model analysis, Tukey’s correction for multiple testing). See also Supplemental Data Set S1. B, Representative pollen of Zmatr-b and Zmatm-b single mutants, and atm (+/−) atr (−/−) and atm (−/−) atr (+/−) sesquimutants. Viability was visualized by Alexander staining. Scale bar = 50 µm. C, Cob phenotype of the atm (+/−) atr (−/−) and atm (−/−) atr (+/−) sesquimutants at 19 DAP (top). Percentage of abnormal kernels per cob of atm (+/−) atr (−/−) and atm (−/−) atr (+/−) sesquimutants (lower).

