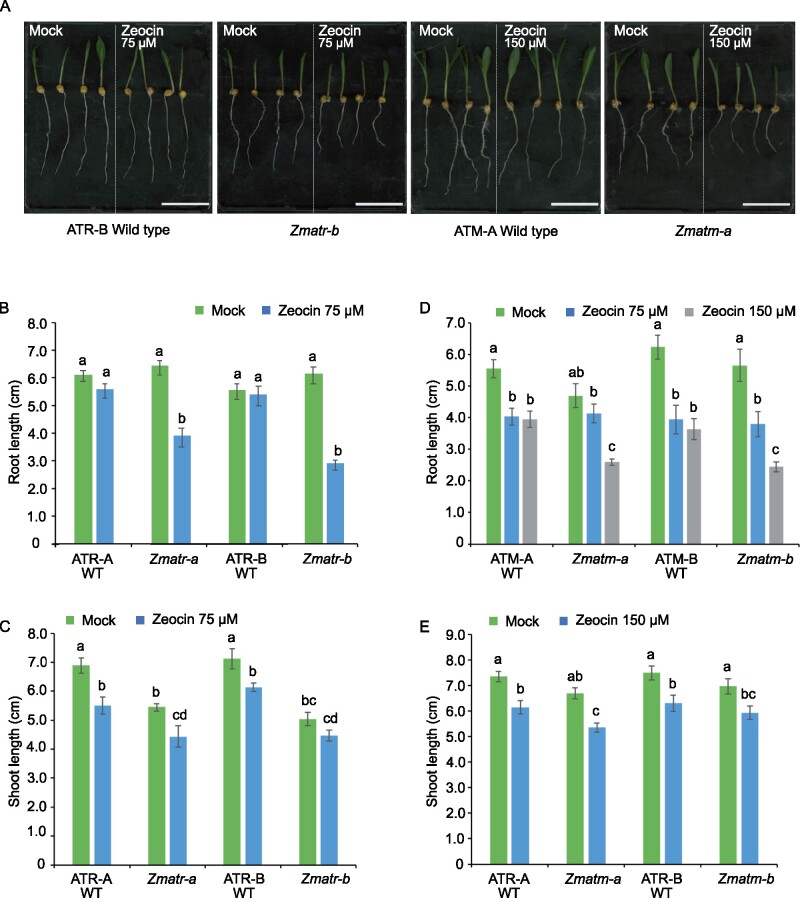
Figure 2.
Both maize ATR and ATM kinases are necessary for resistance to zeocin. A, Representative WT and mutant seedlings following growth for 3 days under control conditions (Mock) or in the presence of 75 or 150 µM zeocin. Scale bar = 5.5 cm. B and D, Quantification of root growth of ATR (B) and ATM (D) WT and mutant seedlings treated as in (A). C and E, Quantification of shoot growth of ATR (C) and ATM (E) WT and mutant seedlings treated as in (A). Letters indicate statistically different growth for each genotype (P < 0.0001, mixed model analysis, Tukey’s correction for multiple testing). Values are average ± se; n = 8–11. Letters on the bars indicate statistically different means (P < 0.05, ANOVA mixed model analysis, Tukey’s correction for multiple testing). See also Supplemental Data Set S1.

