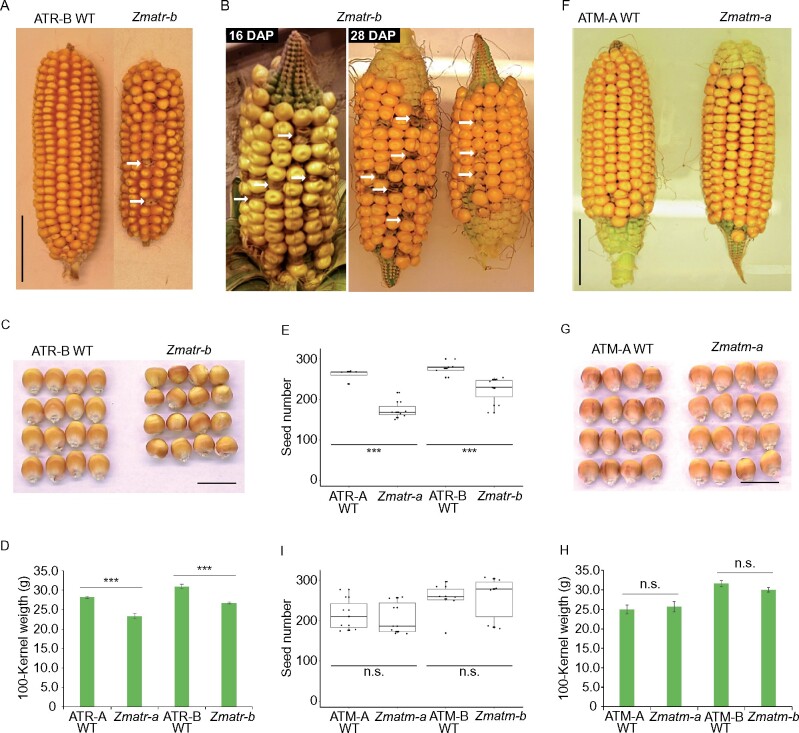
Figure 6.
Phenotypic cob and kernel features of Zmatr and Zmatm mutant plants. A, Representative mature F2 ear of WT and Zmatr-b. Arrows indicate gaps left by early death of kernels. Scale bar = 4 cm. B, Representative F2 ears of Zmatr-b at 16 and 28 DAP. Arrows indicate kernels with abnormal phenotype that eventually die. C, Representative mature kernels of WT and Zmatr-b from a segregated F2 ear. Scale bar = 1.5 cm. D, Comparison of the 100-kernel weight of mature WT and Zmatr kernels of two independent lines. Weight was determined in a segregated F2 population. Values are means ± se; n = 8–12 (***P < 0.001, Student’s t-test). See also Supplemental Data Set S1. E, Number of kernels per cob in WT and Zmatr plants of two independent lines. Values are means ± se; n = 7–10 (***P < 0.001, Student’s t-test). See also Supplemental Data Set S1. F, Representative mature F2 ear of WT and Zmatm-a. Scale bar = 4 cm. G, Representative mature kernels of WT and Zmatm-a from a segregated F2 ear. Scale bar = 1.5 cm. H, Comparison of the 100-kernel weight of mature WT and Zmatm kernels of two independent lines. Weight was determined in a segregated F2 population. Values are means ± se; n = 8–9 (ns, not significant; Student’s t-test). See also Supplemental Data Set S1. I, Number of kernels per cob in WT and Zmatm plants of two independent lines. Values are means ± se; n = 6–7 (ns, not significant; Student’s t- test). See also Supplemental Data Set S1.

