Figure 5.
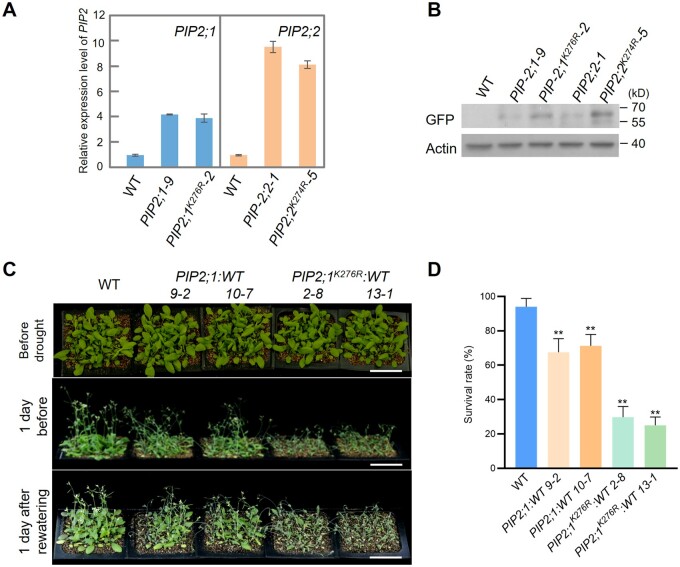
Lys276 and Lys274 are the ubiquitination sites of PIP2;1 and PIP2;2, respectively. A, The RNA level of PIP2;1/2;2 determined by qPCR in WT, GFP-PIP2;1 transgenic plants (PIP2;1-9 and PIP2;1K276R-2) or GFP-PIP2;2 transgenic plants (PIP2;2-1 and PIP2;2K274R-5). ACTIN2 was used as an internal control. B, GFP-PIP2;1/2;2 protein level was determined in WT, GFP-PIP2;1 transgenic plants (PIP2;1-9 and PIP2;1K276R-2) or GFP-PIP2;2 transgenic plants (PIP2;2-1 and PIP2;2K274R-5) using anti-GFP antibody. Actin was used as an internal control. C, Drought tolerance test of PIP2;1 and PIP2;1K276R transgenic plants. Two independent lines were used for each gene. The phenotype was analyzed as in Figure 2a, bar = 5 cm. D, Statistical analysis of the seedling survival rate in (C). Values represent the mean ± sd (five biological replicates; n = 80). Statistical significance was analyzed by one-way ANOVA (**P <0.01). Detailed experiment replicates and statistical analysis are described in the “Method” section.

