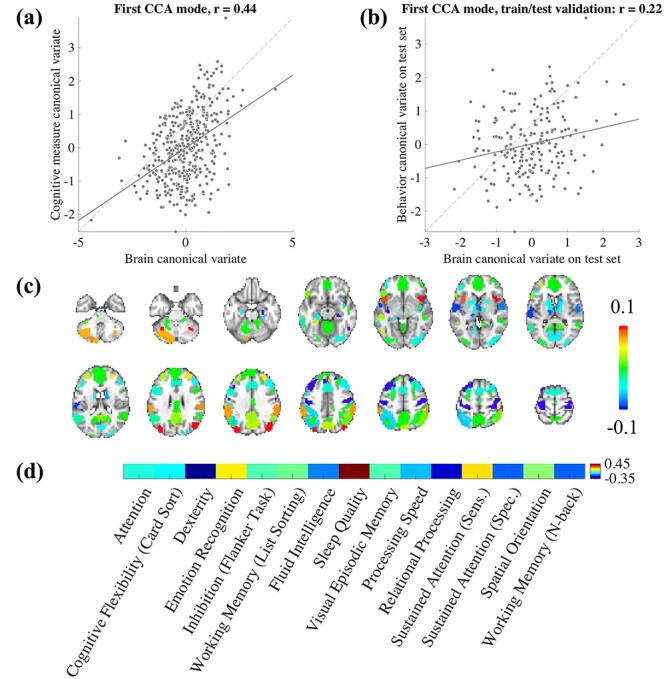
Figure 6 .

Canonical correlation analysis indicates a multivariate association between SampEn and behavioral traits. (a) The first CCA mode reveals significant relationship between brain canonical variate and behavioral variate (dash line indicates the unity line—perfect fitting). (b) Split-halves validation: the canonical coefficients of the first mode were calculated on the first half of the subjects (205 subjects) as a training set, and applied to the remaining 205 subjects as a testing set. The panel indicates the resulting brain-behavior mode on testing set. (c) The projection of first brain mode back to original space, indicating different contribution of ROIs to the mode. (d) The first behavioral measure mode projected back to original space.
