
Figure 7 .
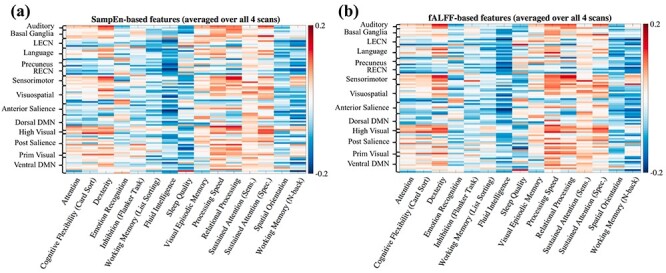
Correlations between regional temporal complexity features and individual cognitive measures. For all panels, color of the (i,j) element indicates the correlation between the SampEn- or fALFF-based features in the ith ROI and the jth cognitive measure, taken across 410 subjects. Both types of features were averaged over all four scans.