Figure 4 .

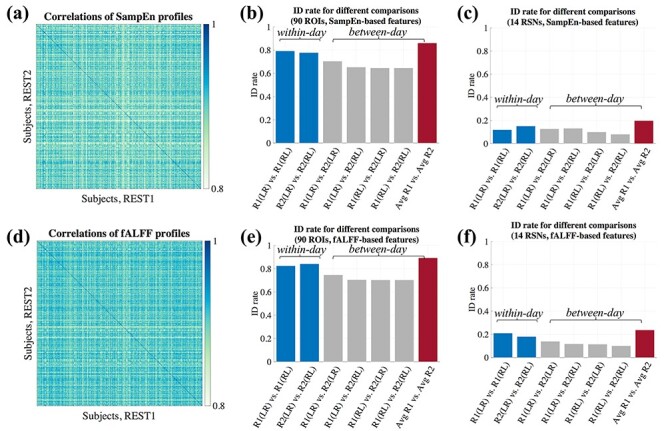
Between-subject differentiation of SampEn (first row) and fALFF-based profiles (second row). In this figure, we use ‘R1’ and ‘R2’ to denote REST1 (session 1) and REST2 (session 2), for brevity. (a,d) Pairwise similarity (Pearson correlation) between profiles of different subjects across two different sessions. Here, the average profiles across the two scans acquired within the first session (REST1) were compared to the average of those acquired in the second session (REST2). The diagonal elements indicate the correlation of profiles for same subjects across different scans. These profiles were calculated using 90 ROIs. (b,e) The identification rate for different pairwise combinations of scans. The blue and gray bars indicate within-session and between-session comparisons, respectively. The red bars denote the between-session comparison where the average of the two scans in REST1 is compared with the average of the two scans in REST2. Panels (c) and (f) show the corresponding results for (b) and (e) based on the profiles constructed from 14 core resting-state networks, respectively. The ID rate drops drastically for all situations in comparison to (b) and (e).
