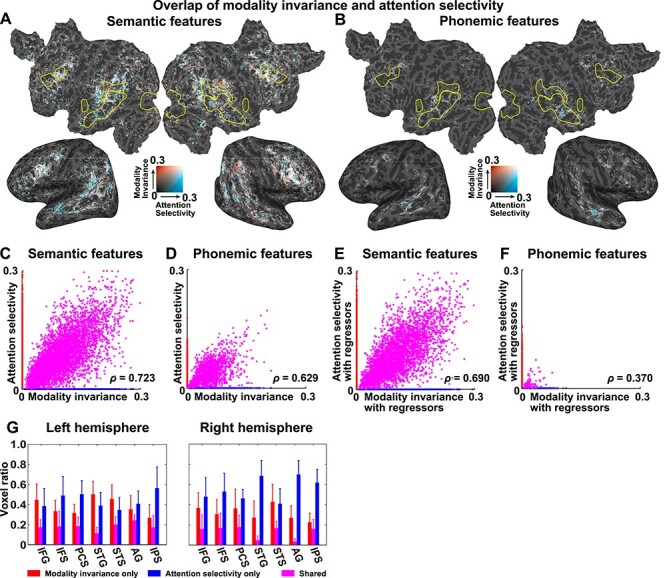
Figure 6 .

Partial overlap between the modality-invariant and attention-selective regions. MI (red) and AS (AS, blue) were mapped onto the cortical surface of participant ID01, using semantic features (A) and phonemic features (B). Only significant regions (P < 0.05, FDR corrected) are shown. A scatter plot is shown for MI and AS, using semantic features (C) and phonemic features (D) (see Supplementary Fig. S16 for the other participants). Data were extracted from the cortical voxels of participant ID01. Data with positive MI and zero AS are colored in red. Data with positive AS and zero MI are colored in blue. Data with positive MI and AS are colored in purple. For each plot, a Spearman’s correlation coefficient (ρ) is displayed. Scatter plots show the MI and AS values, using semantic features (E) and phonemic features (F), with sensory components regressed out (see Supplementary Fig. S17 for the other participants). Motion energy and MTF features were used as sensory regressors. (G) The ratios of voxels exclusively showing positive MI (red), those exclusively showing positive AS (blue), and those showing both MI and AS (purple) are plotted for seven anatomical ROIs in the left (left panel) and right hemispheres (right panel). IFG, inferior frontal gyrus. Error bar, SD.
