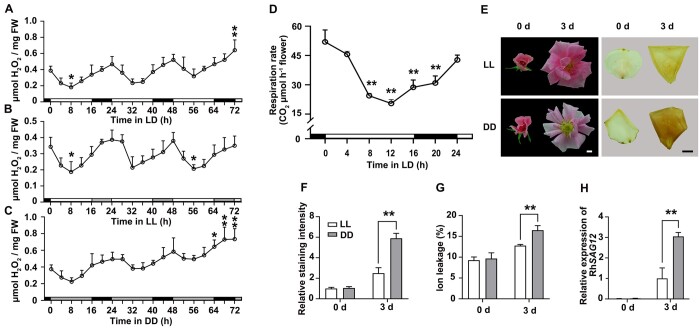
Figure 1.
ROS homeostasis exhibits circadian rhythmicity in rose petals. A–C, H2O2 levels in petals of rose flowers entrained under LD conditions (A), LL (B) or DD (C) for 3 days. For LL and DD treatments, flowers were initially grown under LD conditions and then transferred to LL or DD conditions. Experiments were performed independently twice, with similar results. One representative result is shown. Mean values ± sd are shown from three replicates (n = 3). White horizontal bars, day; black horizontal bars, night; gray horizontal bars, subjective day or night. D, Respiration rate of rose flowers in LD conditions. Mean values ± sd are shown (n = 3 for 0, 4, and 24 h, n = 4 for 8, 12, 16, and 20 h). E, Representative flower phenotype (left) and H2O2 accumulation (right) of petals under LL or DD conditions. H2O2 levels were determined by staining with DAB. Scale bars, 1 cm. F, Relative staining intensity of H2O2 accumulation (n = 4), (G) ion leakage (n = 4 for 0 days, n = 6 for 3 days), and (H) relative expression of RhSAG12 (n = 3) in fully opened (Stage 2) rose flower petals grown under LL or DD conditions. Mean values ± sd are shown. Experiments were performed independently 3 times, with similar results. Asterisks represent statistically significant differences (*P < 0.05; **P < 0.01), as determined by ANOVA (A–D) and Student’s t test (F–H).

