Figure 2.
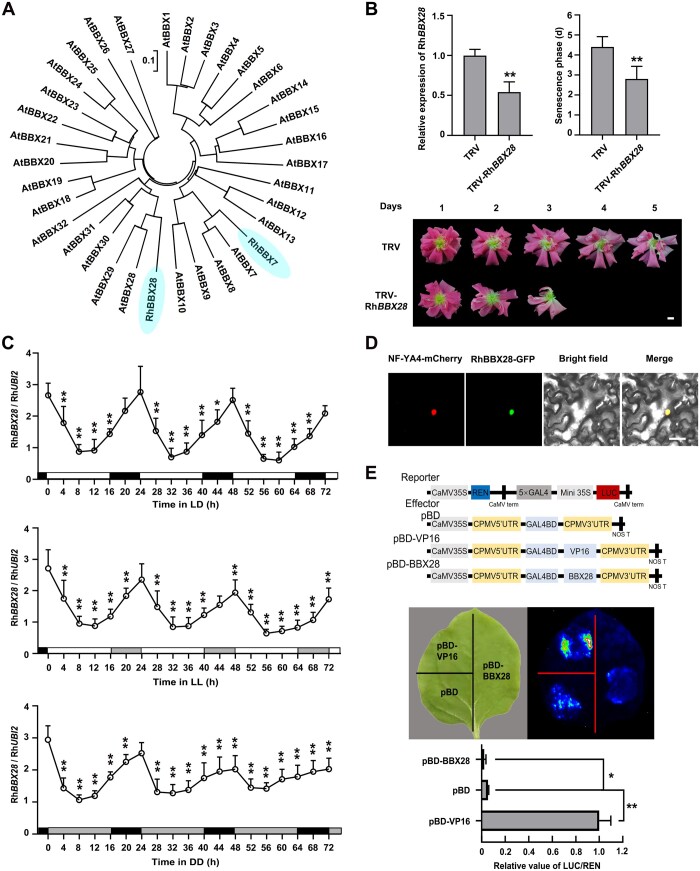
Characterization of RhBBX28. A, Phylogenetic analysis of RhBBX28, RhBBX7, and BBX genes from Arabidopsis. The phylogenetic tree was constructed using MEGA software version 5.05 with the neighbor-joining algorithm. The scale bar indicates the branch length. RhBBX28 and RhBBX7 were highlighted. B, Effects of silencing of RhBBX28 on petal senescence. RT-qPCR analyses of RhBBX28 transcript levels in petals (upper, left), length of the senescence phase (from fully open flowers to senescence) (upper, right), and flower phenotype (lower) of RhBBX28-silenced and TRV (empty vector)-transformed control plants. Flower phenotypes were recorded starting once flowers were fully opened. Experiments were performed independently 3 times, with similar results. Mean values ± sd are shown from 10 replicates (n = 10) for phenotype and five replicates (n = 5) for gene expression test. Scale bar, 1 cm. C, Relative expression levels of RhBBX28 in petals of rose flowers entrained under LD, LL, or DD conditions for 3 days. For LL and DD treatments, flowers were initially grown under LD conditions and then transferred to LL or DD conditions. Experiments were performed independently twice, with similar results. One representative result is shown. Mean values ± sd are shown from five replicates (n = 5). White horizontal bars, day; black horizontal bars, night; gray horizontal bars, subjective day or night. D, Subcellular localization of RhBBX28-GFP in N. benthamiana leaves. The plasmid ProSuper:RhBBX28-GFP was co-infiltrated with the nuclear marker ProSuper:NF-YA4-mCherry. Green and red fluorescence were visualized by confocal microscopy 3 days after infiltration. Scale bar, 50 μm. E, Transcriptional repressor activity of RhBBX28 in N. benthamiana leaves. Upper, schematic representation of Reporter and Effector constructs. The coding sequence with the stop codon was inserted into the pBD effector vector and driven by the 35S promoter. pBD-VP16 was used as a positive control. Middle and bottom, live imaging (middle) and quantitative analysis (bottom) of transcriptional repression activity of the RhBBX28 protein. Mean values ± sd are shown from three replicates (n = 3). The experiments were performed independently twice, with similar results. Asterisks represent statistically significant differences (*P < 0.05; **P < 0.01), as determined by Student’s t test (B and E) and ANOVA (C).

