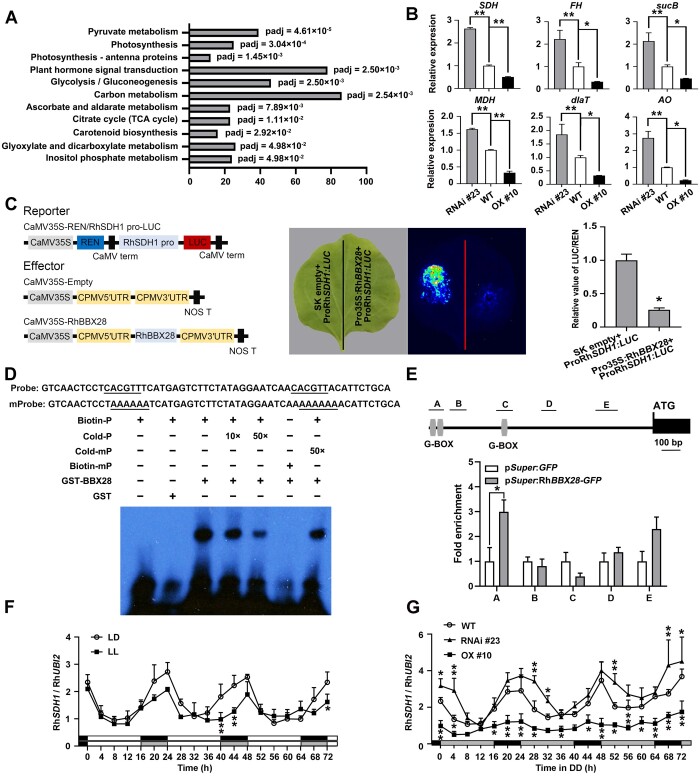
Figure 5.
RhBBX28 influences expression of genes related to respiratory metabolism and ROS homeostasis in rose petals. A, Significantly enriched KEGG pathways in RhBBX28-OX lines based on gene expression analysis. Padj, adjusted P-value of each enriched pathway. B, Expression of genes related to respiratory metabolism and ROS homeostasis in petals of WT, RhBBX28-OX #10, and RhBBX28-RNAi #23 plants. RhUBI2 was used as an internal control. Data are for the genes encoding succinate dehydrogenase (ubiquinone) flavoprotein subunit 1 (SDH, RchiOBHm_Chr2g0101771, and AT5G66760.1), fumarate hydratase 1 (FH, RchiOBHm_Chr6g0294521, and AT2G47510.2), dihydrolipoyllysine-residue succinyltransferase component of 2-oxoglutarate dehydrogenase complex 2 (sucB, RchiOBHm_Chr2g0158941, and AT5G55070.1), malate dehydrogenase (MDH, RchiOBHm_Chr4g0393011, and AT5G43330.1), dihydrolipoyllysine-residue acetyltransferase component 3 of pyruvate dehydrogenase complex (dlaT, RchiOBHm_Chr2g0144451, and AT3G13930.1), and L-ascorbate oxidase homolog (AO, RchiOBHm_Chr6g0279531, and AT1G76160.1). Samples were collected 4 h after lights on (ZT0). Experiments were performed independently twice, with similar results. Mean values ± sd are shown from three biological replicates (n = 3). C, Interaction between RhBBX28 and the RhSDH1 promoter, as shown by a dual LUC reporter system. Left, schematic representation of the constructed dual LUC reporter system. Live imaging (middle) and quantitative analysis (right) of transcriptional repression of the RhSDH1 promoter by RhBBX28. The ProRhSDH1:LUC construct was co-infiltrated with Pro35S:RhBBX28 or SK empty vector into N. benthamiana leaves. Experiments were independently repeated 3 times, with similar results. A representative image of an N. benthamiana leaf 3 days after infiltration is shown. Mean values ± sd are shown from three replicates (n = 3). D, EMSA analysis of RhBBX28 binding to the RhSDH1promoter. The sequence of the region from –1,172 to –1,117 bp of the RhSDH1 promoter was used as a probe. As indicated, RhBBX28-dependent mobility shifts were detected and were competed by unlabeled WT probe in a dose-dependent manner, but not by unlabeled mutated probe. Experiments were performed independently twice, with similar results. For EMSA, the experiments were performed using 1 μg recombinant GST–RhBBX28 proteins mixing with 2 nmol biotin-labeled RhSDH1 probe. E, ChIP-qPCR assay showing RhBBX28 binding to the RhSDH1 promoter in planta. Upper, schematic representation of the RhSDH1 promoter. Black box, RhSDH1 ORF; Gray vertical lines, the putative G-box (−1,162 to −1,157, −1,132 to −1,127, and −889 to −884 bp); Lines above, the fragments amplified in the ChIP-qPCR analysis. A: −1,182 to −1,102 bp, B: −1,076 to −986 bp, C: −939 to −852 bp, D: −591 to −512 bp, E: −297 to −180 bp, relative to the RhSDH1 translation initiation codon (ATG). Lower, ChIP-enrichment of the indicated RhSDH1 promoter fragments (A–E). Petals of RhBBX28 OX #2 line were used for ChIP. The experiment was performed independently twice with similar results and one representative result is shown. G, Relative expression levels of RhSDH1 in petals of WT rose flowers entrained under LD or LL conditions for 3 days. H, Relative expression levels of RhSDH1 in petals of WT, RhBBX28-OX #10 and RhBBX28-RNAi #23 rose flowers entrained under DD conditions for 3 days. For LL and DD treatments, flowers were initially grown under LD conditions and then transferred to LL or DD conditions. Experiments were performed independently twice, with similar results. One representative result is shown. Mean values ± sd are shown from three replicates (n = 3). White horizontal bars, day; black horizontal bars, night; gray horizontal bars, subjective day or night. Asterisks represent statistically significant differences (*P < 0.05, **P < 0.01), as determined by ANOVA (B, F, and G) and Student’s t test (C and E).

