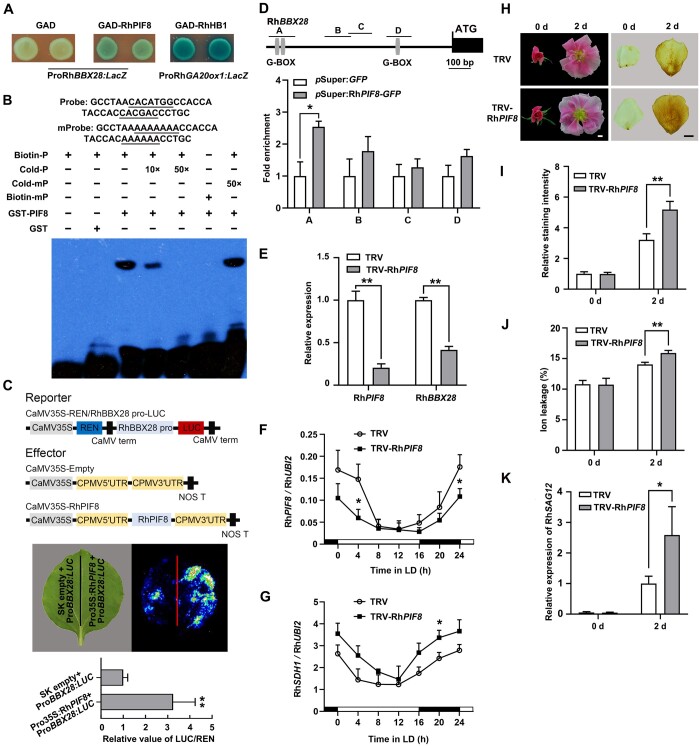
Figure 6.
RhPIF8 is a transcriptional activator of RhBBX28 and affects H2O2 accumulation in petals. A, Y1H analysis of the binding of RhPIF8 protein to the RhBBX28 promoter. GAD–RhPIF8, but not GAD itself, activates the expression of the lacZ reporter gene driven by the RhBBX28 promoter. GAD–RhHB1 with ProRhGA20ox1:LacZ was used as a positive control. Experiments were performed independently twice, with similar results. B, EMSA analysis of RhPIF8 binding to the G-box motifs in the RhBBX28 promoter. The sequence of the region from –764 to –729 bp of the RhBBX28 promoter was used as a probe. As indicated, RhPIF8-dependent mobility shifts were detected and were competed by unlabeled WT probe in a dose-dependent manner, but not by unlabeled mutated probe. For EMSA, the experiments were performed using 1 μg recombinant GST–RhPIF8 proteins mixing with 2 nmol biotin-labeled RhBBX28 probe. Experiments were performed independently twice, with similar results. C, Transactivation of RhBBX28 by RhPIF8. Upper, schematic representation of dual LUC reporter system. Middle and bottom, live imaging (middle), and quantitative analysis (bottom) of the transcriptional activation of the RhBBX28 promoter by RhPIF8. The ProRhBBX28:LUC construct was co-infiltrated with Pro35S:RhPIF8 or SK empty vector in N. benthamiana leaves. Experiments were independently repeated 3 times. A representative image of an N. benthamiana leaf is shown 3 days after infiltration. Mean values ± sd are shown from four replicates (n = 4). D, ChIP-qPCR assay showing RhPIF8 binding to the RhBBX28 promoter in planta. Upper, schematic representation of the RhBBX28 promoter. Black box, RhBBX28 ORF; Gray vertical lines, the putative G-box (−758 to −752, −739 to −734, and −271 to −266 bp); Lines above, the fragments amplified in the ChIP-qPCR analysis. A: −793 to −680 bp, B: −562 to −448 bp, C: −462 to −357 bp, D: −299 to −192 bp, relative to the RhBBX28 translation initiation codon (ATG). Lower, ChIP-enrichment of the indicated RhBBX28 promoter fragments (A–D). Rose petals expressing pSuper:RhPIF8-GFP were used for ChIP. The experiment was performed independently twice with similar results and one representative result is shown. E, RT-qPCR analysis of RhPIF8 and RhBBX28 transcript levels in petals of RhPIF8-silenced and TRV control plants. Mean values ± sd are shown from three replicates (n = 3). RhUBI2 was used as an internal control. F and G, Relative expression of RhPIF8 (F) and RhSDH1 (G) in petals of RhPIF8-silenced and TRV controls in LD conditions. Mean values ± sd are shown from at least three replicates (n = 4). RhUBI2 was used as an internal control. H, Flower phenotypes (left) and H2O2 accumulation (right) in petals of RhPIF8-silenced and TRV control plants in DD conditions for 2 days. For DD treatment, flowers were initially grown under LD conditions and then transferred to DD conditions. Experiments were performed independently twice, with similar results. One representative result is shown. Scale bars, 1 cm. I, Relative staining intensity of H2O2 accumulation (n = 6 for TRV-RhPIF8 in 0 days, n = 5 for TRV in 2 days, n = 7 for the rest), (J) ion leakage (n = 4 for TRV in 0 days, n = 3 for TRV-RhPIF8 in 0 days, n = 8 for 2 days), and (K) relative expression of RhSAG12 (n = 3) in petals of RhPIF8-silenced and TRV controls in DD conditions. H2O2 levels were determined by staining with DAB. Mean values ± sd are shown. RhUBI2 was used as an internal control. Asterisks represent statistically significant differences (*P < 0.05; **P < 0.01), as determined by Student’s t-test.

