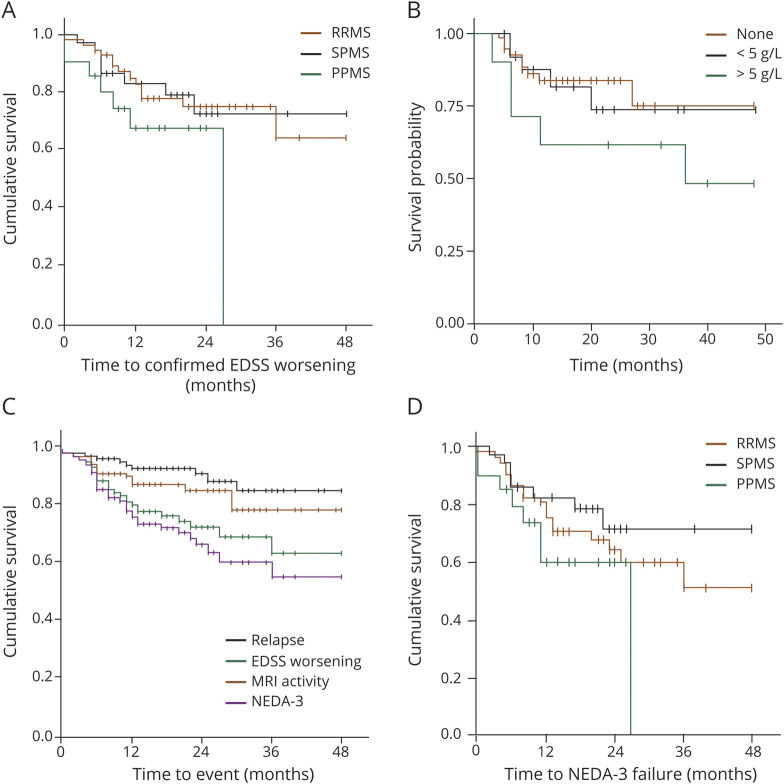
Figure 3. Survival Analyses of MS Outcomes in the Longer Term.
(A) Kaplan-Meier (KM) analysis of time to confirmed Expanded Disability Status Scale (EDSS) score worsening in the relapsing-remitting (RR) multiple sclerosis (MS), secondary progressive MS (SPMS), and primary progressive (PPMS) subtypes. (B) KM of time to confirmed EDSS score worsening according to paraproteinemia (red line, none; green line, <5 g/L; blue line, ≥5 g/L) illustrates the association detected by multivariate analysis (reported in Results). (C) KM of no evidence of disease activity-3 (NEDA-3) and its components: time to relapse, to new T2 MRI lesion, and to confirmed EDSS score progression in the whole population. (D) KM of NEDA-3 in the RRMS, SPMS, and PPMS subgroups.

