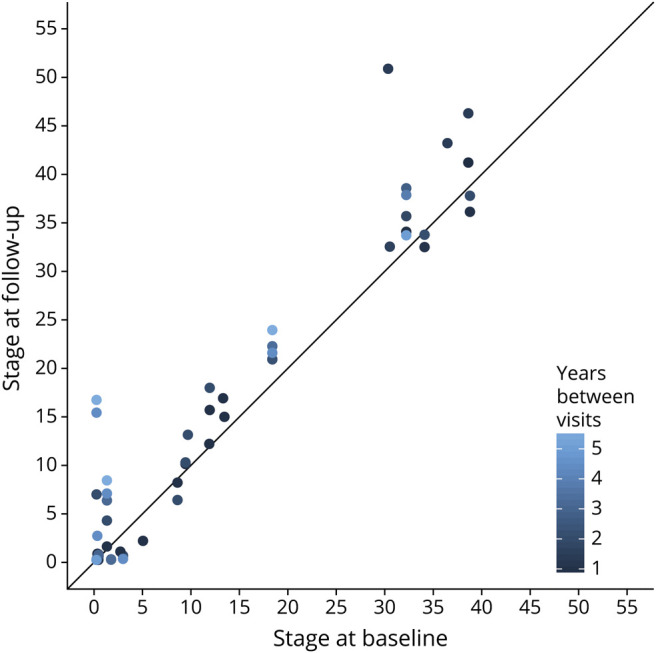
Figure 2. Stage Progression at Follow-Up Visits.

Each point represents an individual’s Subtype and Stage Inference (SuStaIn) stage at baseline and follow-up, with the color indicating the time between baseline and follow-up.

Each point represents an individual’s Subtype and Stage Inference (SuStaIn) stage at baseline and follow-up, with the color indicating the time between baseline and follow-up.