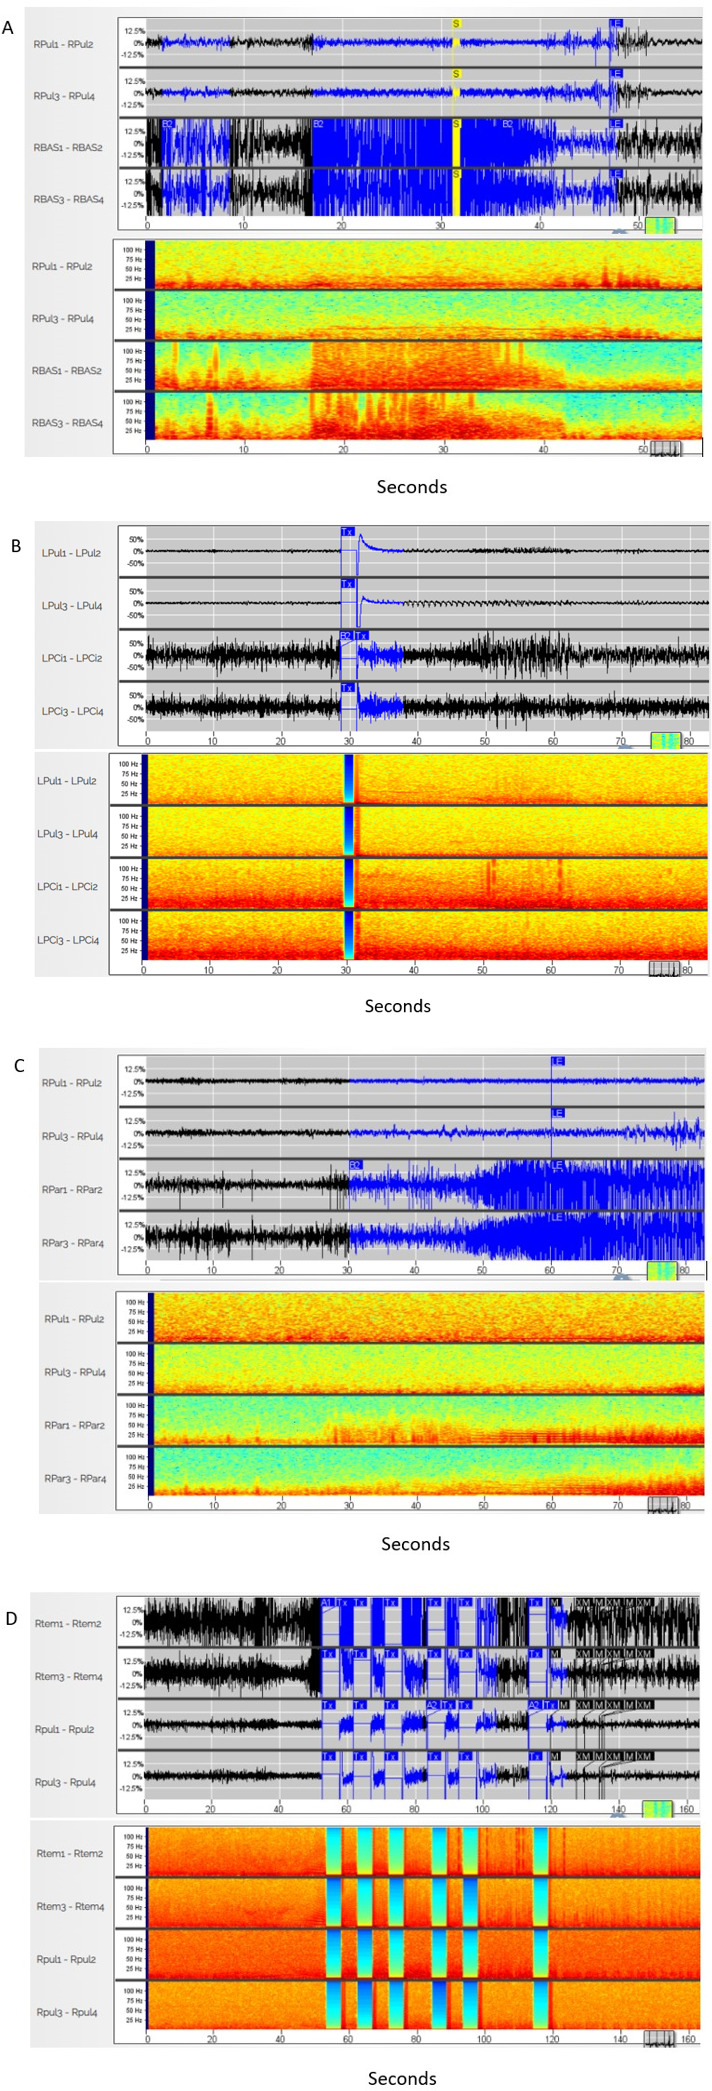
FIGURE 3.

Electrographic seizure example recording in both time and frequency domains for each patient. (A) Patient 1–right pulvinar depth lead displayed on first 2 channels, right occipital cortical strip displayed on bottom 2 channels; (B) patient 1–left pulvinar depth lead displayed on first two channels, occipital depth on lower 2 channels; (C) patient 2–right pulvinar depth displayed on first 2 channels, right parietal depth bottom 2 channels; (D) patient 3–right pulvinar depth displayed on lower two channels and right occipitotemporal depth on upper 2 channels
