
Figure 6. High‐affinity memory IgM counteracts IgG‐mediated self‐destructive autoimmune responses in vivo .
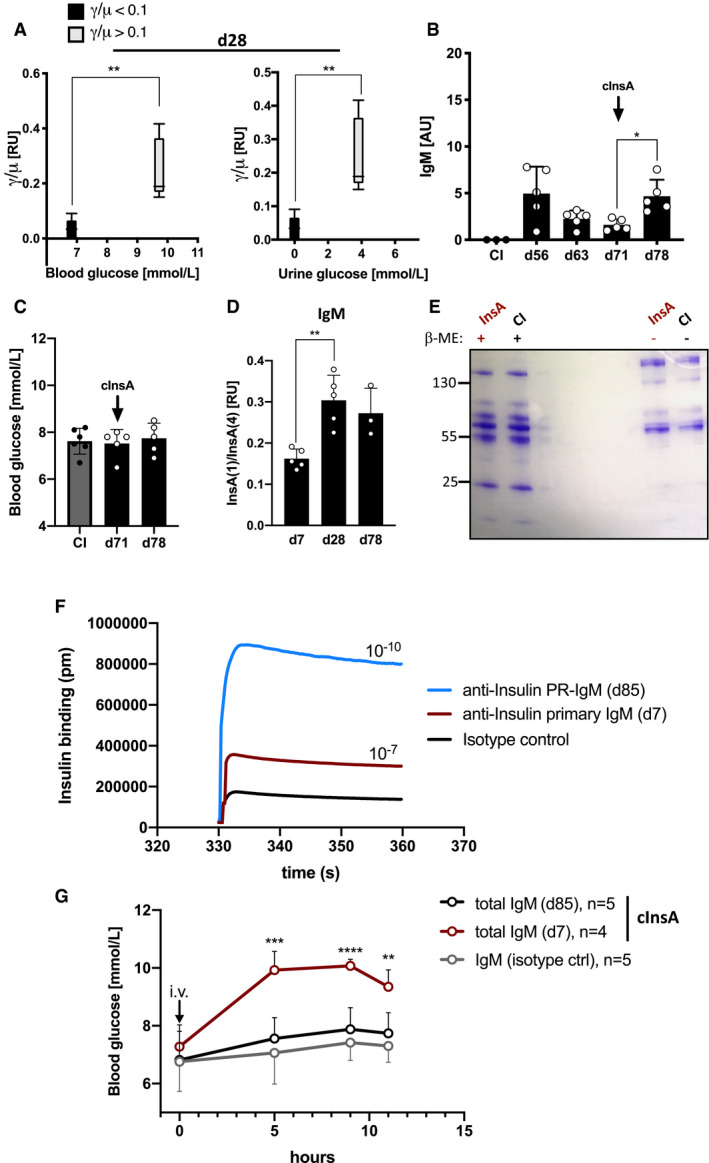
- Ratios of IgG to IgM derived from ELISA values plotted on a two‐dimensional graph against blood glucose levels (left panel) and urine glucose levels (right panel) for n = 5/group. Central bands: median, boxes: interquartile range, whiskers: max./min., statistical significance was calculated by using Mann–Whitney U‐test, **P < 0.01.
- Serum anti‐insulin‐IgM titers of mice immunized with InsA peptide with a γ/µ ratio < 0.1 (black, n = 5) and CI (gray, n = 3) mice measured by ELISA at indicated days (coating: insulin). Dots represent individual mice. Mean ± SD, statistical significance was calculated by using repeated measure ANOVA test, *P < 0.05.
- Blood glucose levels of InsA‐peptide‐immunized mice (γ/µ < 0.1, black, n = 5) and CI (gray, n = 6) mice were assessed at indicated days post‐immunization with a commercial blood glucose monitor device. Dots represent individual mice. Mean ± SD, statistical significance was calculated by using Kruskal–Wallis test, all comparisons were not significant.
- Insulin‐specific IgM affinity maturation of InsA‐peptide‐immunized mice at indicated days was measured by ELISA. Ratios of IgM binding to InsA(1) and InsA(4) (referring to molar antigen density) were calculated and plotted as relative units (n = 5 for d7, d28; n = 3 for d78). Dots represent individual mice. Mean ± SD, statistical significance was calculated by using repeated measure ANOVA test, **P < 0.01. Serum dilutions: 1:25.
- Coomassie‐stained SDS–PAGE showing purified serum IgM of complex InsA‐peptide (cInsA)‐immunized and CI mice under reducing (+β‐ME), and non‐reducing conditions. Representative of two independent experiments.
- Anti‐insulin affinity of PR‐IgM (blue), primary IgM (red), and isotype control (black) measured by bio‐layer interferometry. IgM binding to insulin was acquired in pm and used to calculate the dissociation constant shown in the graph (Kd = 1/Ka). Graph is showing antigen‐antibody association phase. Data are representative for three independent experiments.
- Blood glucose levels of intravenously injected mice with purified IgM from control immunization (CI, n = 5), complex InsA peptide (cInsA) immunization day 7 (total IgM d7, n = 4) and day 85 (total IgM d85, n = 5). Mean ± SD, statistical significance was calculated by using repeated measure ANOVA test showing comparison of red to black line, **P < 0.01, ***P < 0.001, ****P < 0.0001.
Source data are available online for this figure.