
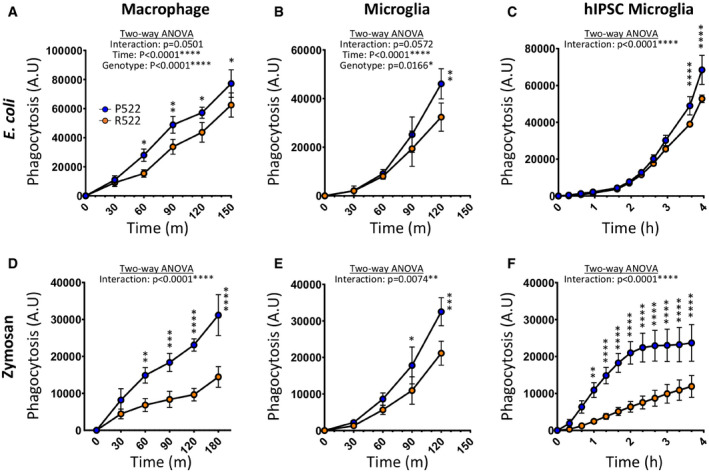
Figure 4. Protective R522 M‐MOP and microglia display decreased phagocytosis of E. coli and zymosan when compared with common P522 variant cells.
-
A–FPhagocytotic activity of R522 and P522 M‐MOP and microglia was assessed using pHrodo Red E. coli and zymosan BioParticles. Phagocytosis arbitrary units (A.U) describe the amount of bioparticle cellular fluorescence emission at each time point. E. coli uptake in M‐MOP (A), primary mouse microglia (B) and hiPSC‐derived microglia (C). Zymosan uptake in M‐MOP (D), primary mouse microglia (E) and hiPSC‐derived microglia (F). For hiPSC‐derived microglia, 3 isogenic P522 and 3 isogenic R522 clones were examined with at least 6 wells in three independent experiments. All microglia and M‐MOP data show the mean ± SD of three independent experiments and were analysed by two‐way ANOVA using Sidak multiple comparison test. *P < 0.05, **P < 0.01, ***P < 0.001 and ****P < 0.0001 (blue: P522 and red: R522).